CARL2 vs Ballchasing.com
Two of the most-used replay tools in Rocket League, built for different jobs. An honest comparison of what each one does and which one fits how you play.
The short version
Ballchasing.com is the community's replay library: a huge public database you upload to, browse, and share through a link, with a clean in-browser 3D viewer and solid baseline stats. It is good at that.
CARL2 is a desktop analysis suite. It goes much deeper into a single match, a full series, and your long-term progress, and it adds live coaching and broadcast tools Ballchasing doesn't have. Everything runs on your own PC, with no upload limits, and the free tier already does more per replay than Ballchasing.
If your goal is to get better, CARL2 gives you more to work with. If you mainly want to store and share replays on the web, Ballchasing is hard to beat. Plenty of people use both.
Reach for CARL2 when…
you want to understand why games went the way they did: xG on every shot, passing networks, 50/50s, boost control, series trends, win-vs-loss habits, or live coaching and casting.Reach for Ballchasing when…
you want a public link to a replay, a place to browse pro and tournament games, or a quick percentile read on how your boost and positioning compare to everyone at your rank.Side by side
| Feature | CARL2 | Ballchasing.com |
|---|---|---|
| Cost & access | ||
| Free to start | ✓ | ✓ |
| Replays you can analyzehow many games you can process | ✓Unlimited, processed locally | ◐~70 uploads/week free |
| Paid tier | Optional Pro, €4.99/mo (yearly & lifetime options) unlocks series, lifetime, compare & export | Patreon from $2/mo, mostly higher upload limits & cosmetic perks |
| Where it runs | Windows desktop app (needs BakkesMod) | Any web browser |
| Single-replay depth | ||
| Core stats: boost, positioning, movement, demos | ✓ | ✓ |
| Expected Goals (xG) & shot quality | ✓ | ✕ |
| Passing & connection networks | ✓ | ✕ |
| 50/50s, giveaways, interceptions, possession changes | ✓ | ✕ |
| Kickoff & goal-buildup maps | ✓ | ✕ |
| Boost control & pickup-route maps | ✓ | ◐Boost totals, no route maps |
| 3D maps (passes, goals, paths, dribbles) | ✓ | ✕ |
| Outlier / anomaly detection | ✓ | ✕ |
| Series & long-term | ||
| Multi-game series analysis | ✓Pro | ◐Groups aggregate basic stats |
| Win-vs-loss, evolution & correlations | ✓Pro | ✕ |
| Player lifetime / career tracking | ✓Pro | ✕ |
| Head-to-head player compare | ✓Pro | ✕ |
| Data export (CSV / JSON / LLM-ready) | ✓Pro | ◐Developer API |
| Live & broadcast | ||
| Live / real-time match analysis | ✓ | ✕ |
| Coach, caster & observer/referee modes | ✓ | ✕ |
| Live minimap, boost / speed / throttle meters | ✓ | ✕ |
| OBS stats-screen overlay for streams | ✓ | ✕ |
| Sharing, community & privacy | ||
| Public replay database to browse | ✕ | ✓148M+ replays |
| In-browser 3D replay viewer | ✕ | ✓ |
| Shareable public replay links | ✕ | ✓ |
| Percentile benchmarks vs the whole playerbase | ◐Rank compare | ✓ |
| Your replays stay private on your PC | ✓ | ◐Uploaded to the cloud |
✓ full support · ◐ partial or limited · ✕ not available
What Ballchasing does well
Ballchasing earned its place. It hosts well over a hundred million replays in a single searchable database, so you can pull up pro matches, tournament groups, or a specific player's games in seconds. Upload a replay and you get a shareable link and a clean in-browser 3D viewer that's great for spotting rotations and reviewing a play with a teammate. Each replay comes with a solid set of stats covering boost, positioning, movement, demos, and camera settings, and because the dataset is so large it can show you how your numbers stack up against the wider playerbase at your rank. There's also a documented API that a lot of third-party tools build on.
The limits: free accounts can upload about 70 replays per week (roughly ten a day), and going past that means waiting for the rolling window to clear or supporting the site on Patreon for higher limits. The analysis itself stays at the box-score-plus-heatmap level. There's no expected goals, no passing or possession breakdown, no series or career view that tracks you over time, and nothing live. It is a replay library and viewer first, and an analysis tool second.
Where CARL2 goes further
CARL2 processes a replay locally in 10 to 30 seconds and opens it across a set of focused tabs, so you're reading one part of the game at a time instead of scanning a wall of numbers. The difference shows up most in the questions it can answer.
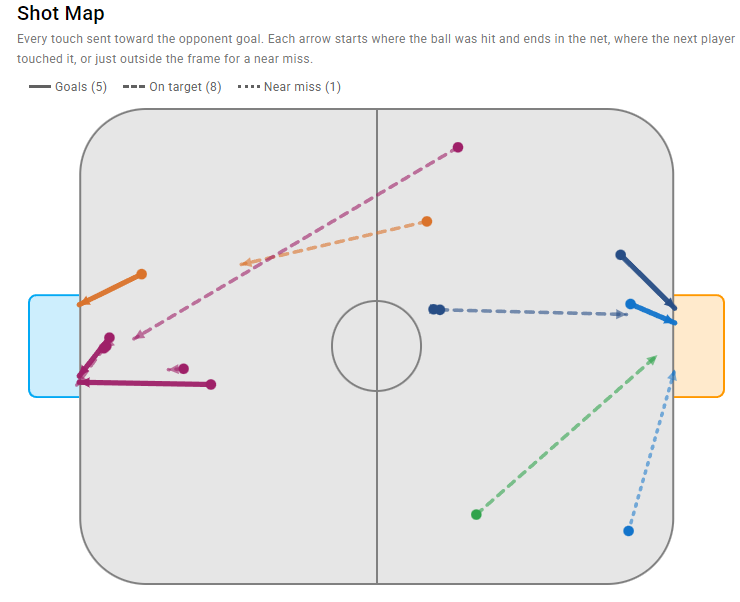
Every shot gets an Expected Goals (xG) value based on distance, angle, ball speed, the shooter's boost, and defenders in the lane, so you can tell a good chance from a hopeful one. The shot map colors every attempt by outcome and filters near misses, shots on target, and goals separately.
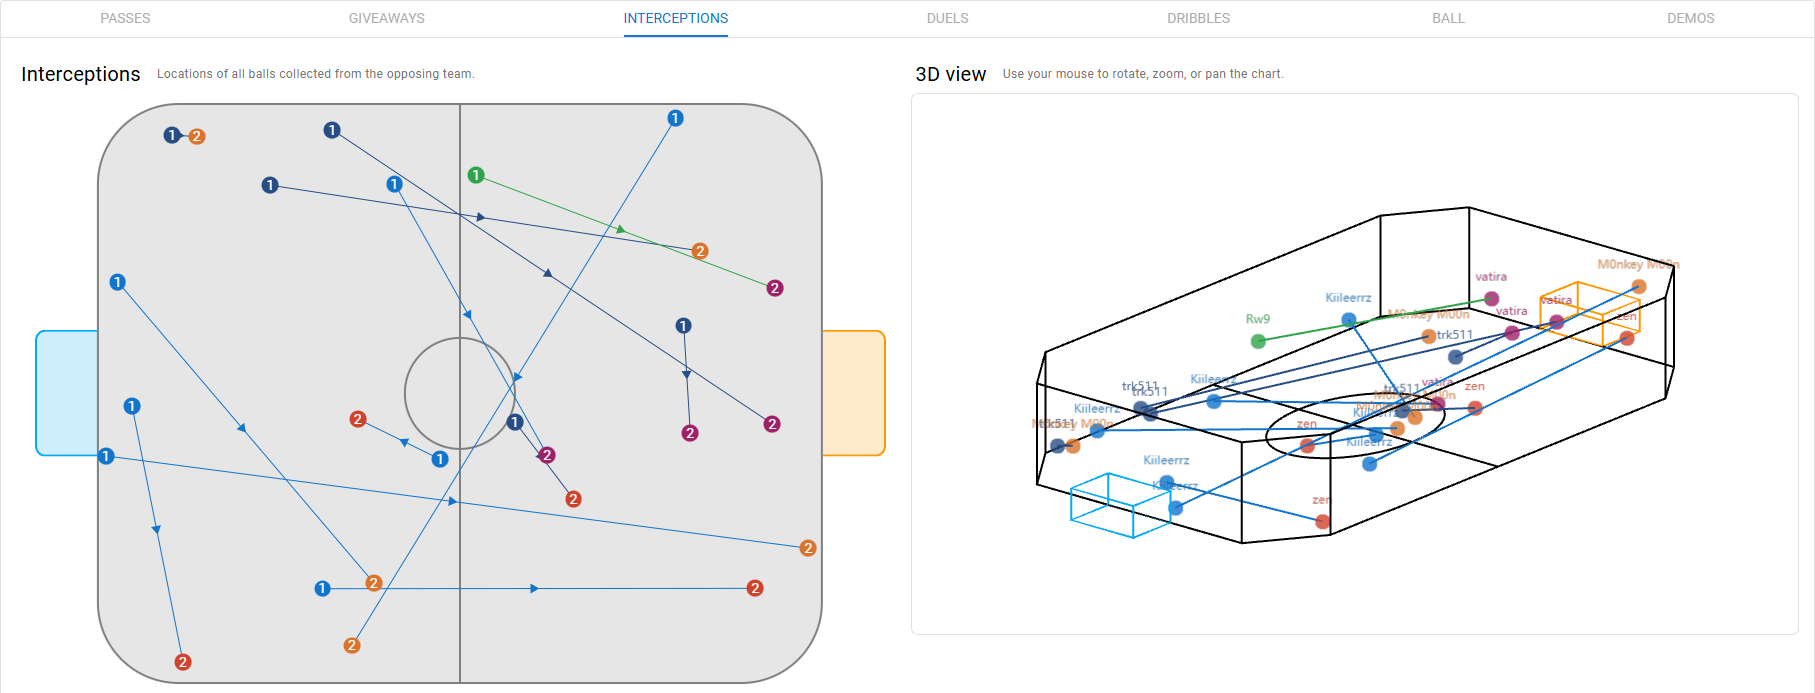
Interactions break down by type: passes, giveaways, 50/50s, dribbles, demos, and possession changes, each filterable per player. If you keep coughing up the ball in the same spot, it shows up here instead of staying invisible in a box score.
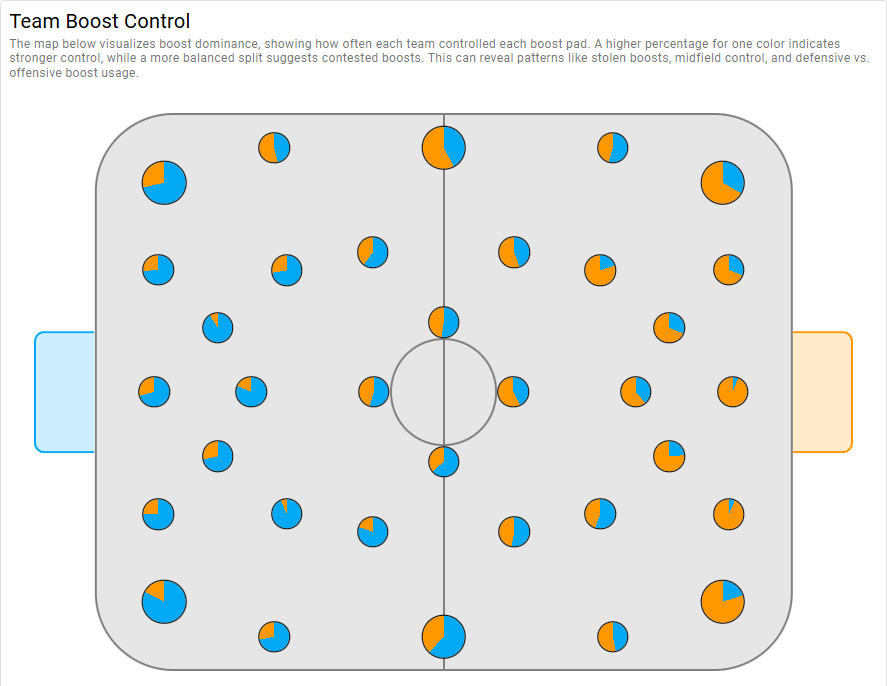
Boost is more than a number. CARL2 maps where you collect pads, shows team boost control across the field, and overlays your pickup routes. Repeat the same path and the line gets thicker, making predictable habits obvious.
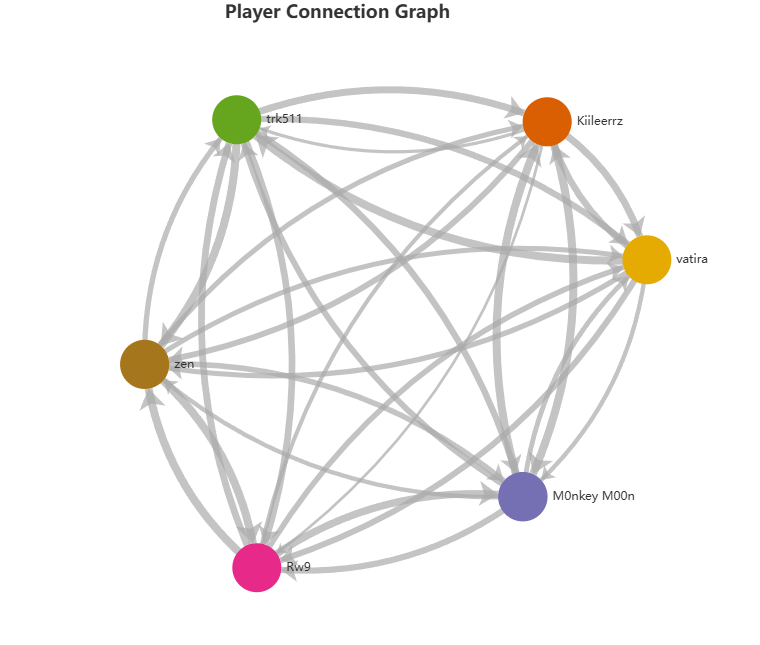
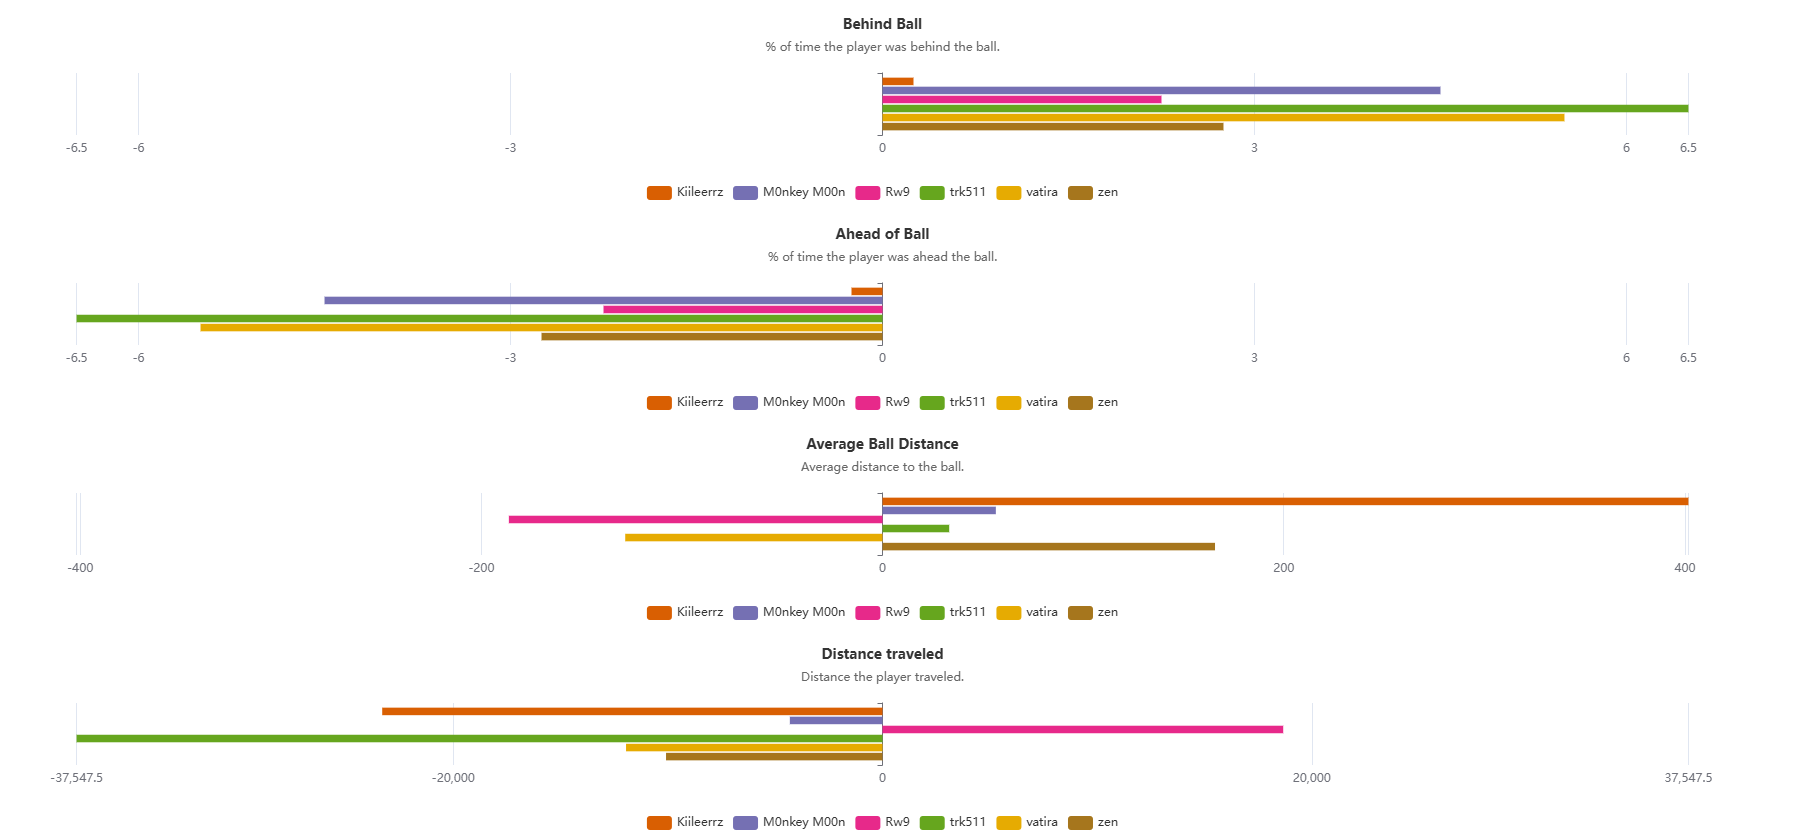
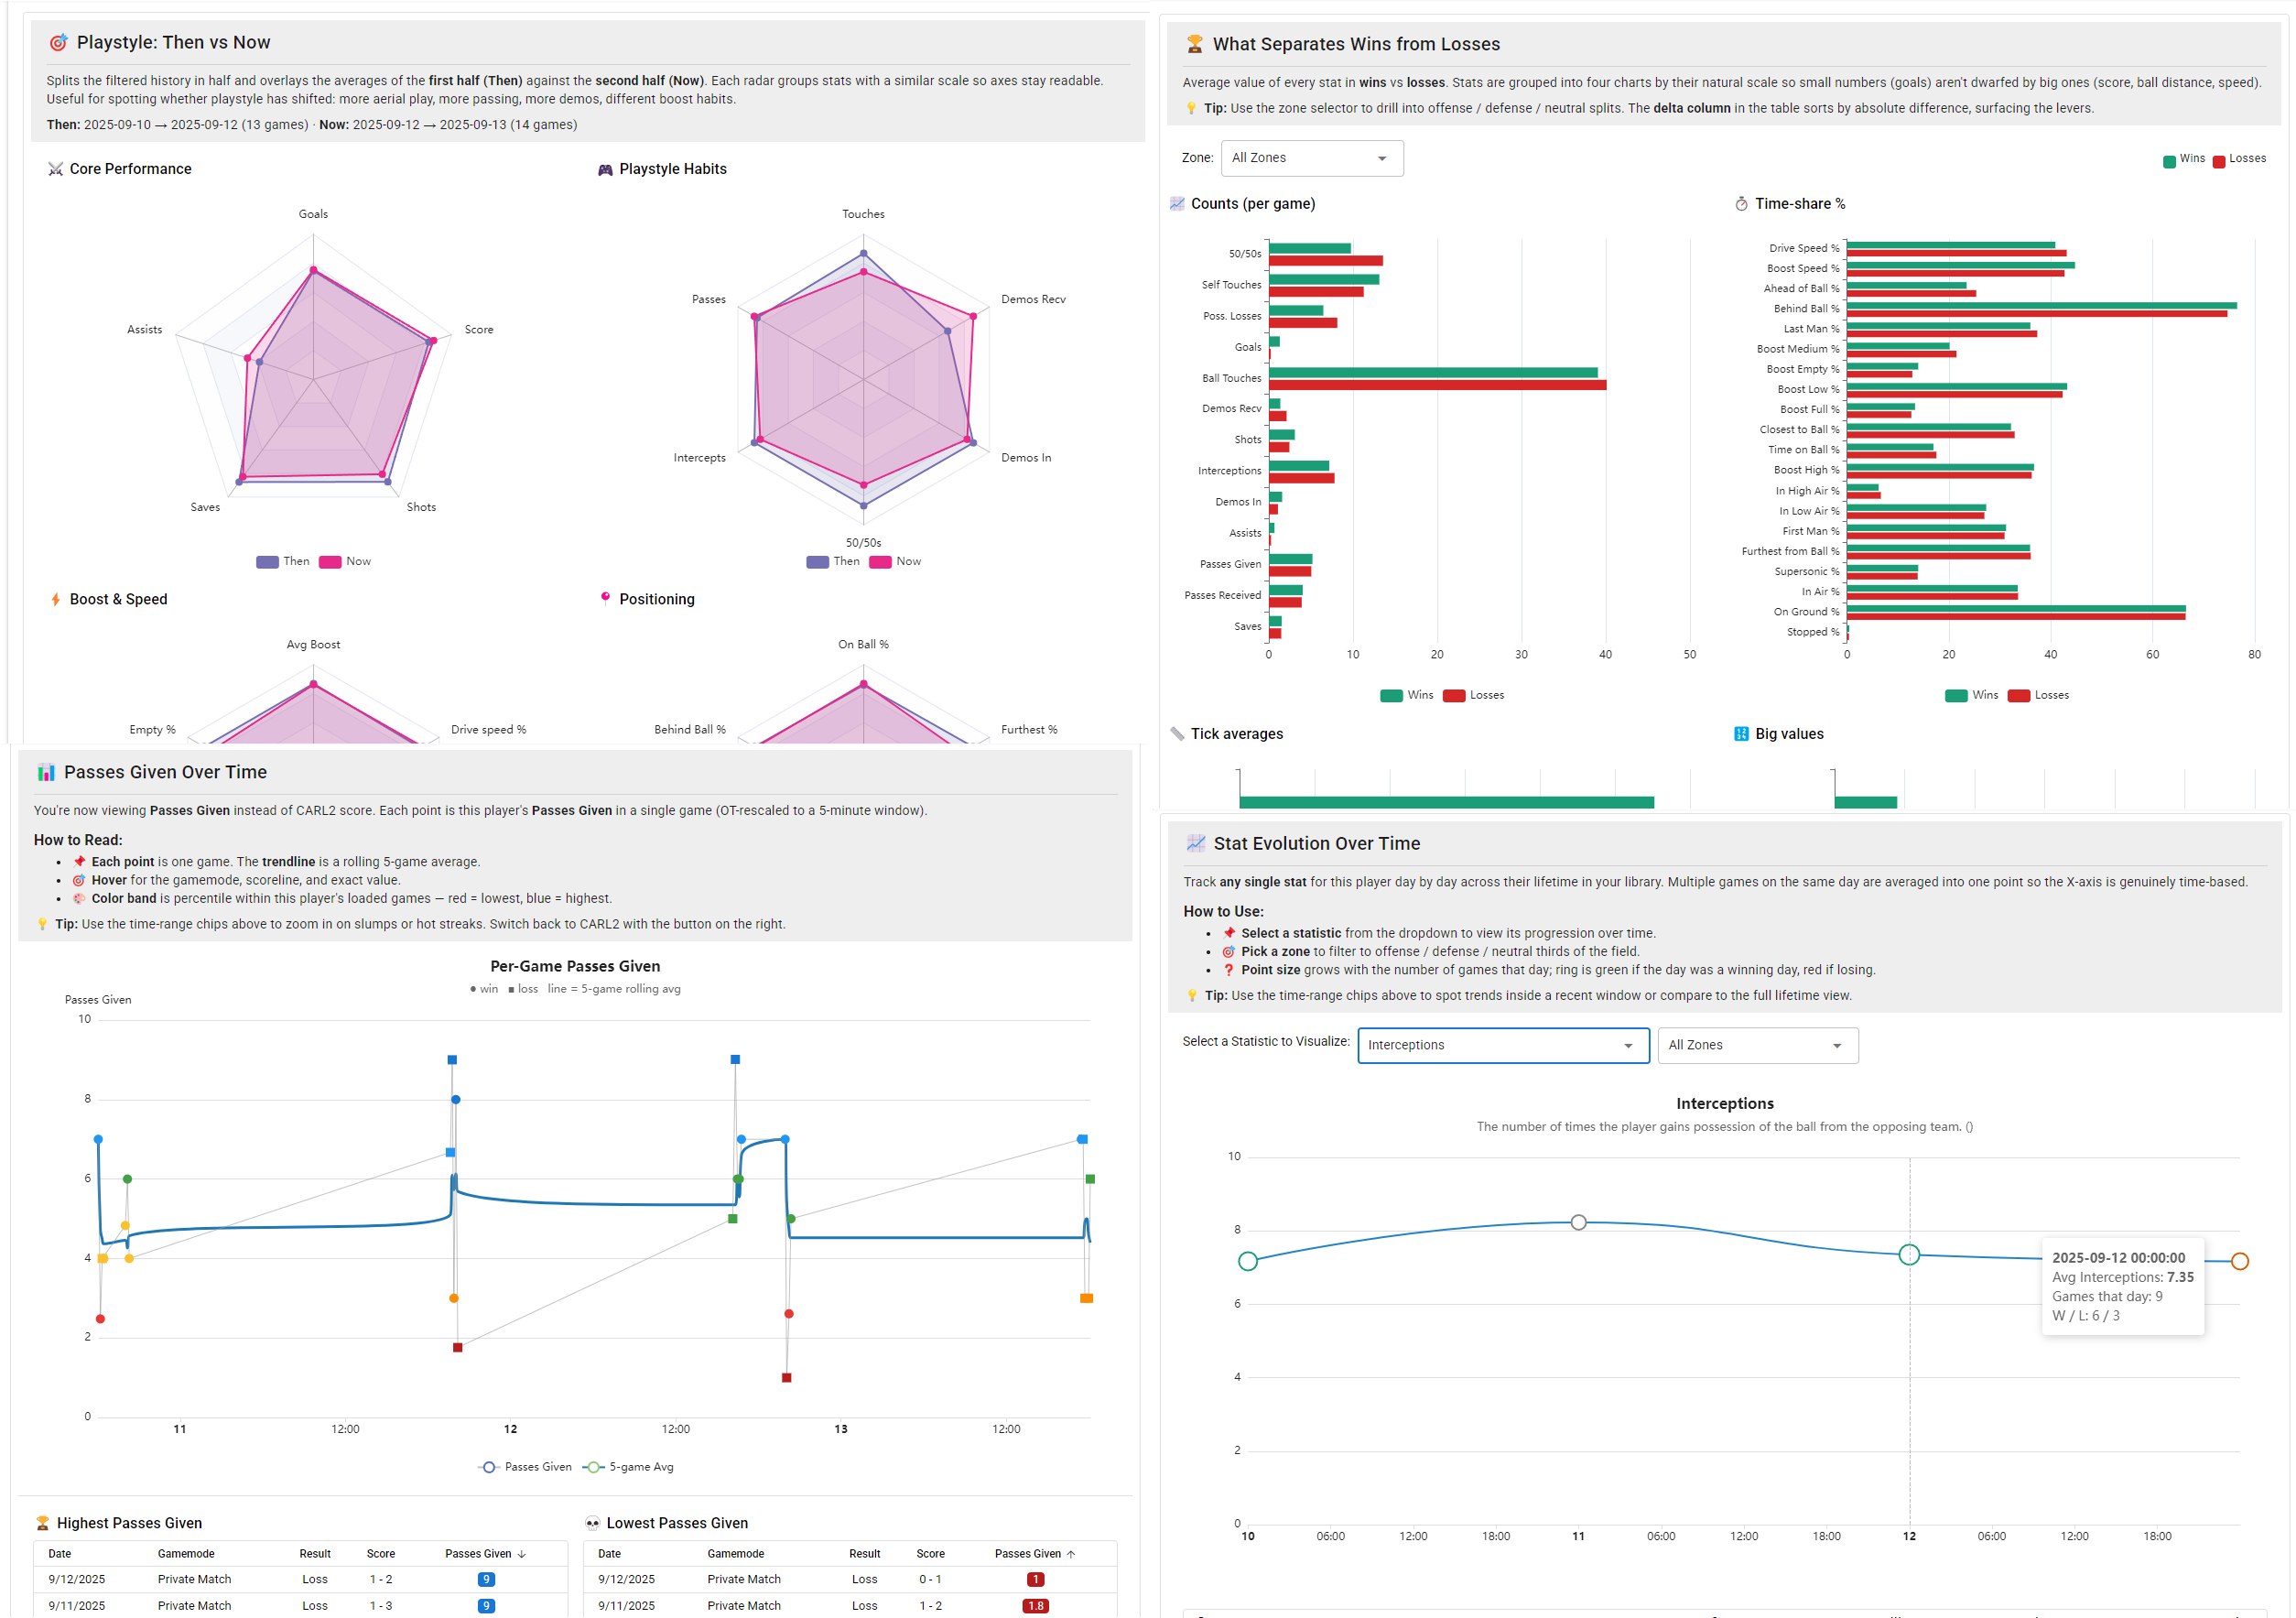
Load a whole series and the patterns stand out. Tendencies that stay hidden in a single game become obvious across five or ten. Passing and connection graphs show which teammates the ball moves through, win-vs-loss analysis shows the habits you fall into when you're behind, and evolution charts track each stat game by game.
CARL2 indexes every game you process by player. Pick anyone you've played with or against and see their full record across your saved games: CARL2 score over time, stats evolution, then-vs-now playstyle, gamemode splits, and your most frequent teammates and opponents with shared win rates. It's progress tracking Ballchasing has no equivalent for.
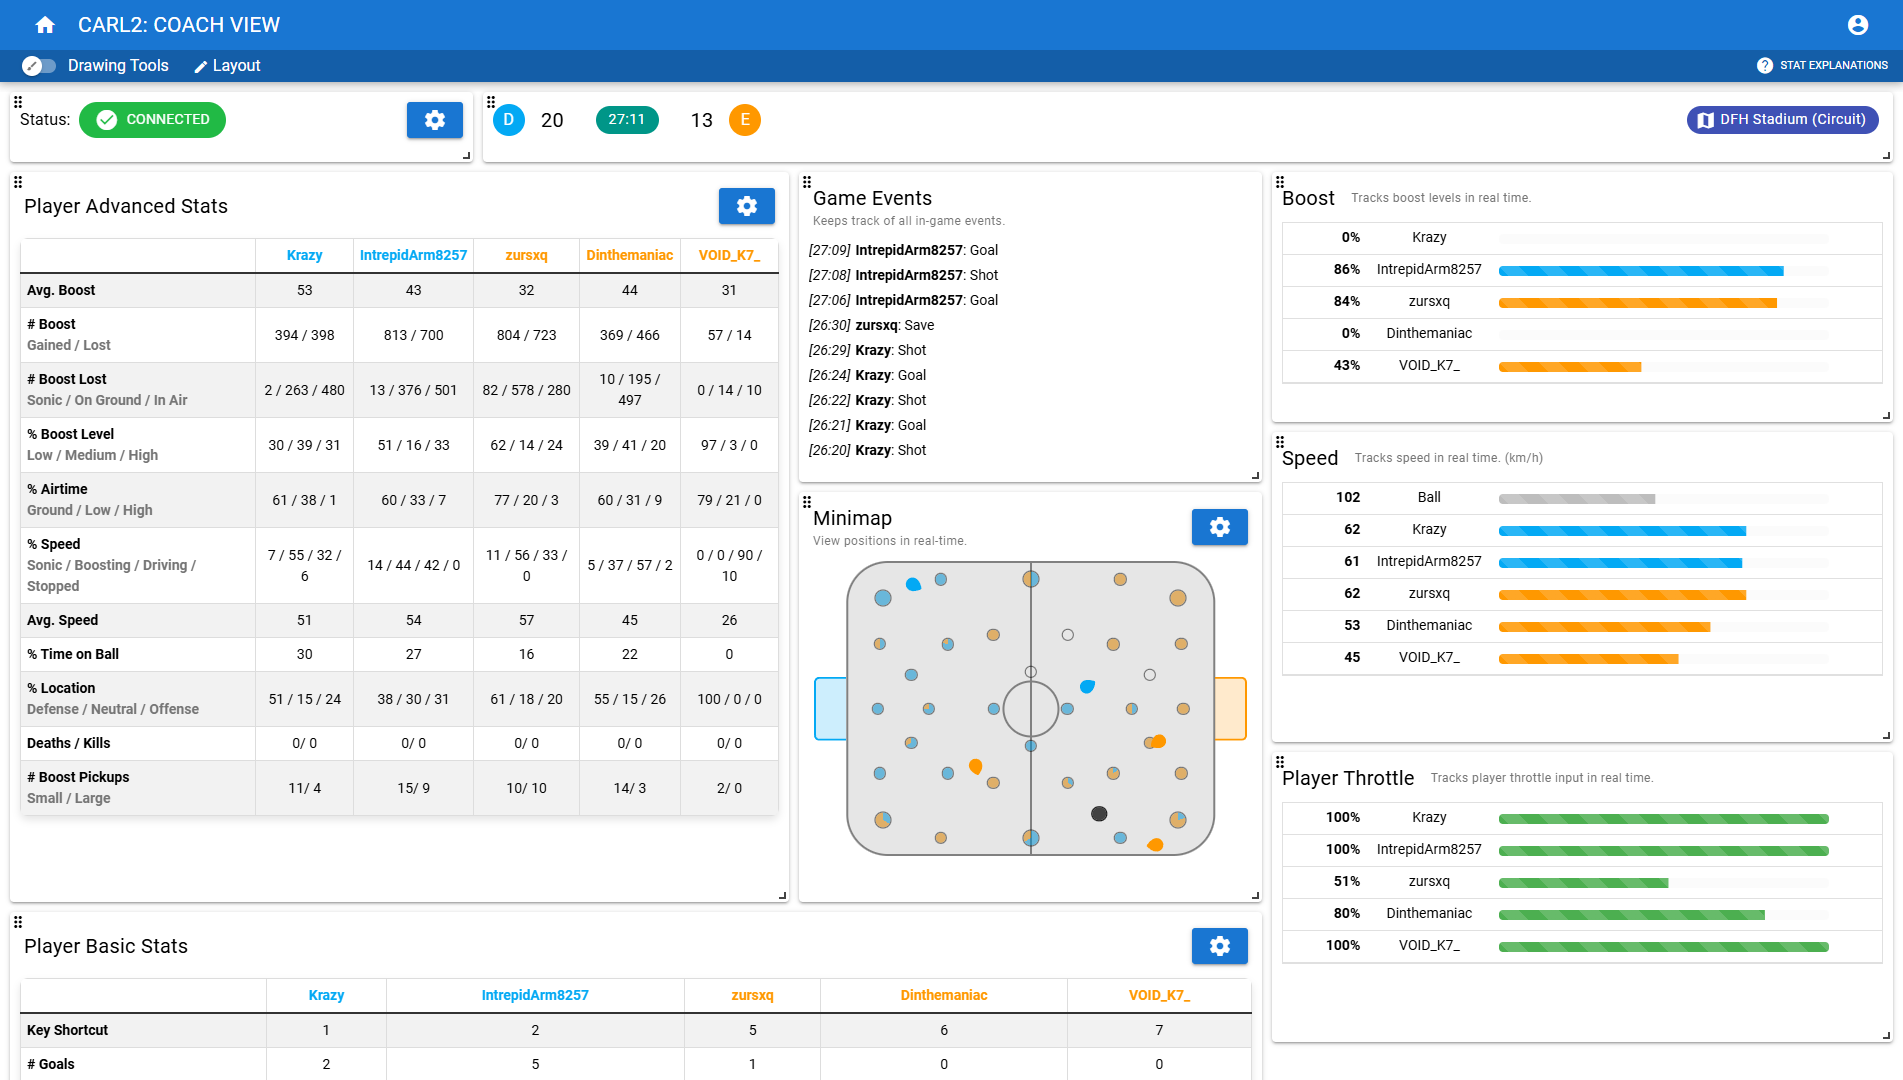
And it works live. CARL2 connects to a running Rocket League session and shows a minimap, boost and speed meters, and a live stat feed. Coach mode gives you team stats and chat history to react mid-game; caster mode trims it down for commentary; observer mode tracks pings and events for tournament admins. A browser-source stats screen with a dozen designs drops the same data straight into OBS for streams.
The trade-offs
Neither tool wins on everything.
CARL2
- Far deeper per-replay analysis: xG, 3D maps, 50/50s, possession, passing networks, kickoffs, boost routes
- Series, lifetime, and head-to-head views that track you over time
- Live coaching, casting, observer modes and an OBS stats overlay
- No upload limits; process as many replays as you like
- Runs locally; your replays and stats stay on your machine
- Generous free tier; Pro is a few euros a month
- Windows desktop app that needs BakkesMod installed
- No public database to browse other people's replays
- No shareable public web link for a single replay
- Series, lifetime, compare and export sit behind Pro
Ballchasing.com
- Massive searchable database of 148M+ public replays
- Clean in-browser 3D replay viewer, nothing to install
- Shareable links and replay groups for teams and events
- Percentile benchmarks against the whole playerbase
- Open, well-documented API
- Works from any browser on any OS
- Free uploads capped at ~70/week (about 10/day)
- No expected goals, passing, possession or 50/50 breakdowns
- No series trends, career tracking or player compare
- Nothing live; post-game only, with no coaching tools
Pricing, compared
Both tools are free to start, and both have a paid tier. Each one charges for something different.
Ballchasing's Patreon (from $2/month) mostly raises your upload limit and adds cosmetic perks. It does not unlock deeper analysis; the stats are the same whether you pay or not.
CARL2 is free to download, and the free tier covers full single-game analysis and every live mode with no upload limits. Pro (€4.99/month, with cheaper yearly and one-time lifetime options; check the app for current pricing and any sale) adds the multi-game series suite, player lifetime tracking, head-to-head compare, and data export to CSV, JSON, or an LLM-ready file you can hand to ChatGPT or Claude for coaching. CARL2's Pro tier adds analysis the free tier doesn't have, rather than a bigger upload quota.
So which should you use?
Ranked grinder who wants to climb: CARL2. The single-game tabs and lifetime tracking show you the specific habits costing you games, and the free tier already covers it.
Coach or team analyst: CARL2. Series analysis, win-vs-loss breakdowns, passing networks and live coach mode are built for exactly this, and you can export everything for your own notes.
Caster or streamer: CARL2. Caster mode and the OBS stats screen give your broadcast live numbers Ballchasing can't provide.
You want to share a replay or study pros: Ballchasing. The public link and the database are its real strengths, and CARL2 doesn't try to replace them.
Use both. Upload to Ballchasing when you want a link or a quick percentile check, and open the same replay in CARL2 when you want to understand what happened. The one that does more of your work, for free, is CARL2, so install that one first.
Ballchasing figures (upload limits, stat categories, Patreon tiers, and database size) are taken from ballchasing.com and its FAQ, and reflect what was published when this page was last updated. Limits and pricing on both tools can change, so check each site for the current details. Not affiliated with Ballchasing.com.