CARL2: Rocket League Analysis & Coaching Tool
What CARL2 Does
CARL2 is a free desktop companion for Rocket League players, coaches, and casters. Load a replay and get detailed stats in under 30 seconds. Analyze a single game or compare dozens at once. Spectate a live match and see boost levels, speed, and positioning update in real time. Everything runs locally and connects directly to your Rocket League data, turning raw replays into charts, heatmaps, and visualizations you can actually act on.
Players use it to spot habits they didn't know they had. Coaches use it to break down team patterns and prep for opponents. Casters use it to pull live stats that make broadcasts more interesting. Watch the trailer below to see it in action.
Process Replays
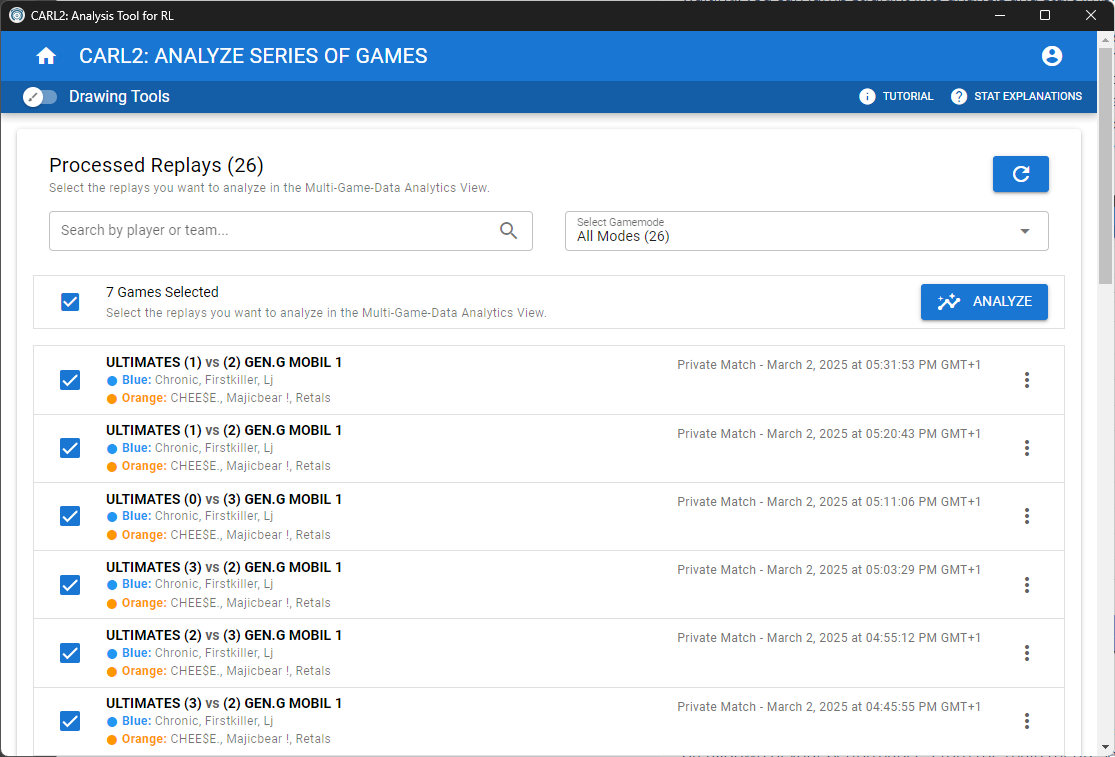
Select a replay file from Steam, Epic Games, or any folder and hit Process Replay. CARL2 extracts player stats, movement data, boost events, and every in-game action in 10 to 30 seconds. Processed replays are saved and available from the main menu whenever you want to go back to them.
Processing in bulk is straightforward. A Skip button lets you move past a replay manually, and if one stalls for more than 5 seconds a countdown kicks in and skips it automatically. Filter your library by date range or search by player name, team name, or multiple names at once using commas to find exactly what you're looking for.
Replays can be tagged with custom labels to organize your library. Group tournament games, scrim sessions, or matchups against a specific opponent and filter down to them in one click.
Analyze a Single Game
Open any processed replay and explore it across a set of dedicated tabs. Each one focuses on a specific part of the game so you're not hunting through a wall of numbers to find what matters.
Match Overview shows rosters, scores, and a performance radar chart so you can see at a glance who carried and who struggled. CARL2 Scores give each player a single number relative to the match average, with a breakdown of every contributing stat and a marker showing whether each one was above or below the norm. Outlier Detection flags anything unusually high or low and tells you whether it's worth looking into further.
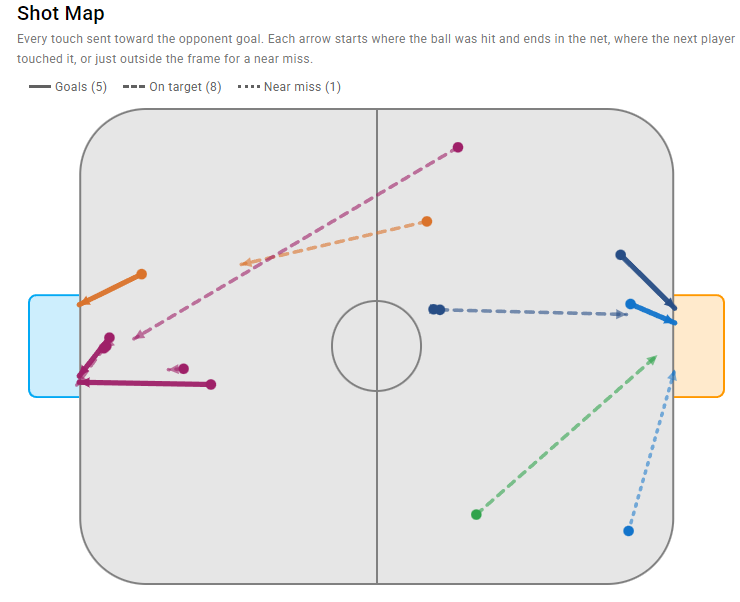
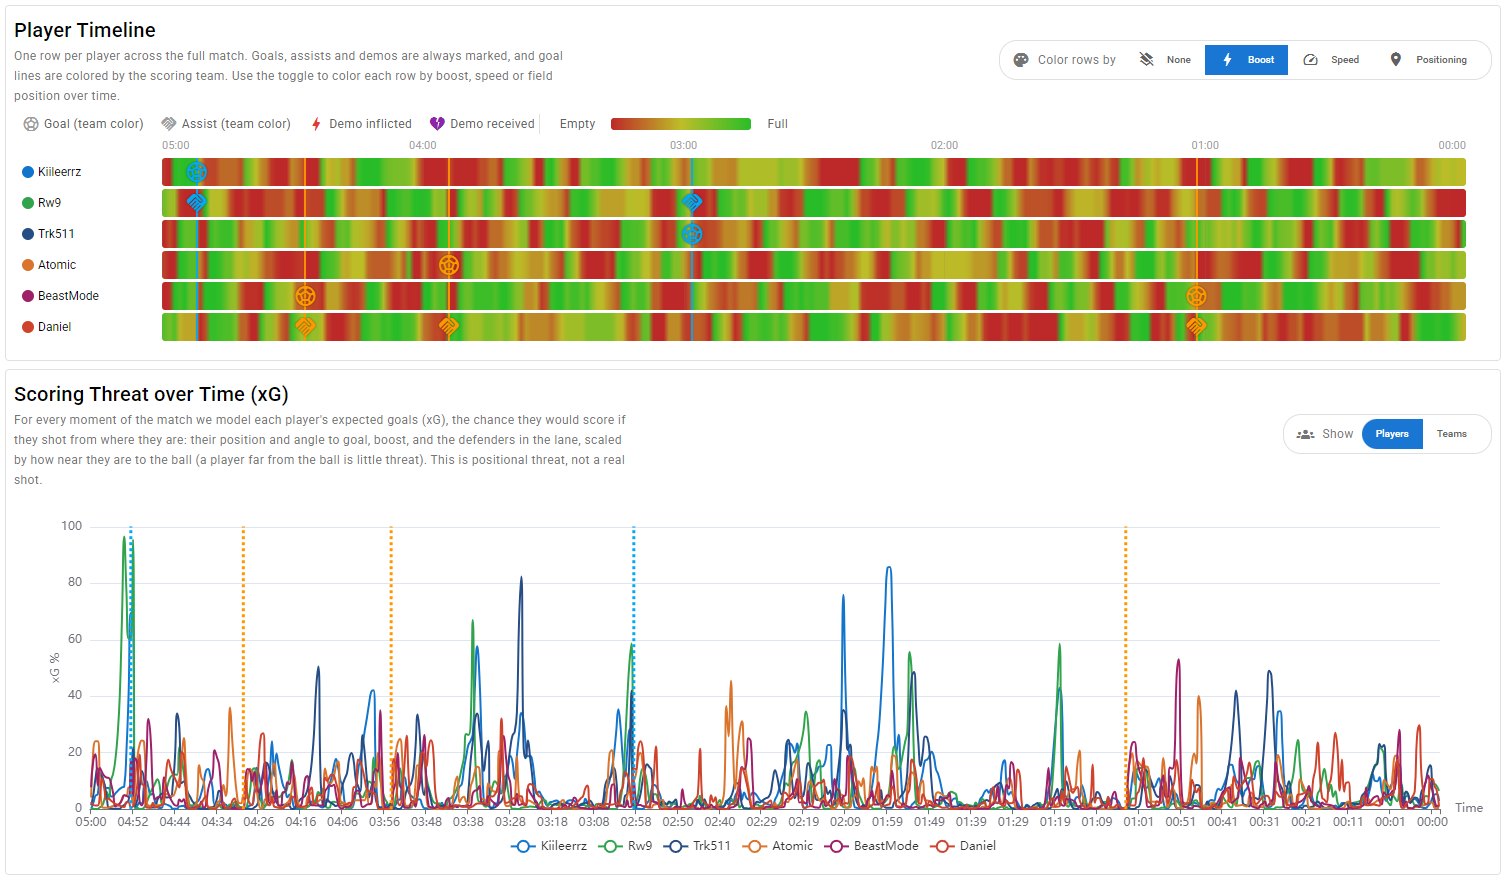
Goals maps every goal location and includes a Shot Map showing an arrow for every attempt toward goal, colored by outcome. Near misses, shots on target, and goals each have their own filter. The Expected Goals (xG) model scores each shot by how likely it was to go in, based on distance, angle, ball speed, the shooter's boost, and defenders in the lane. A Player Timeline puts one row per player across the full match, marking goals, assists, and demos, color-coded by boost level, speed, or field position. It's an easy way to see how momentum shifted and who was on or off the ball at key moments.
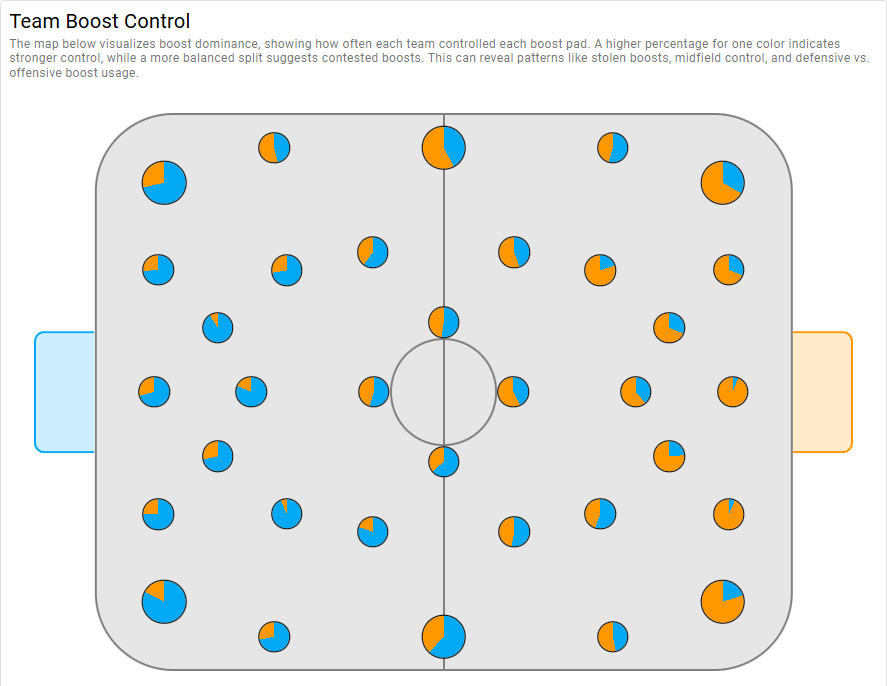
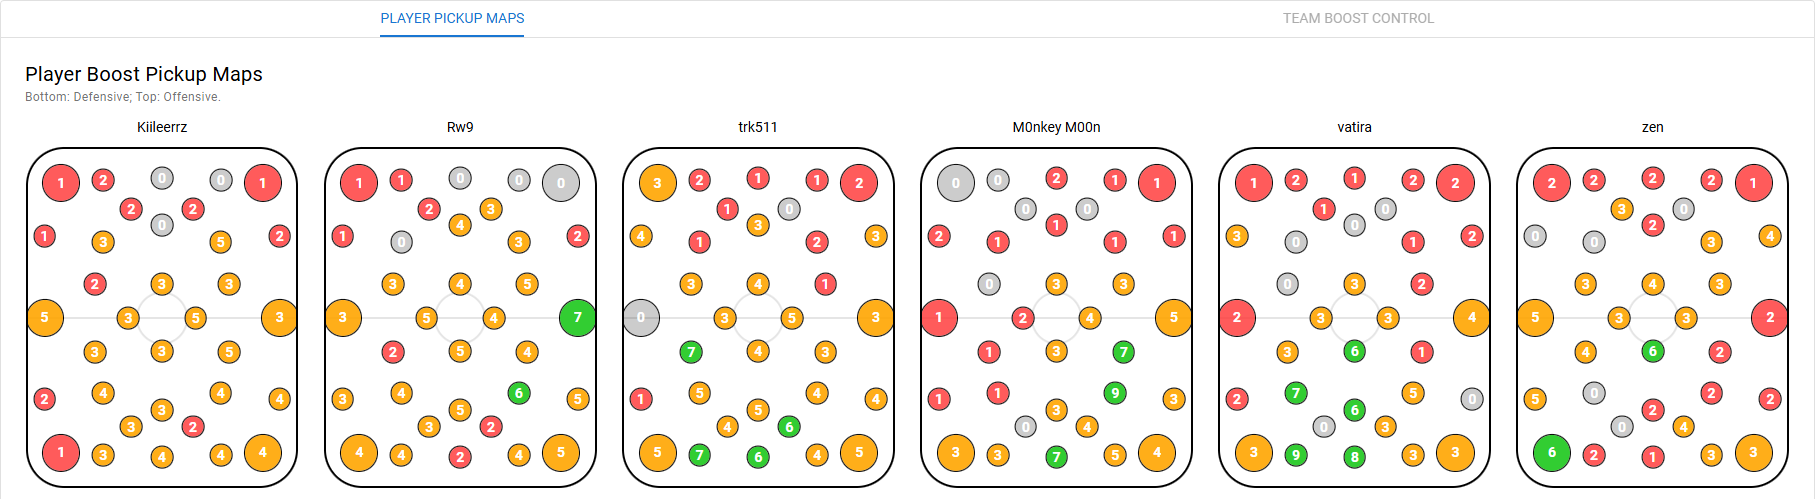
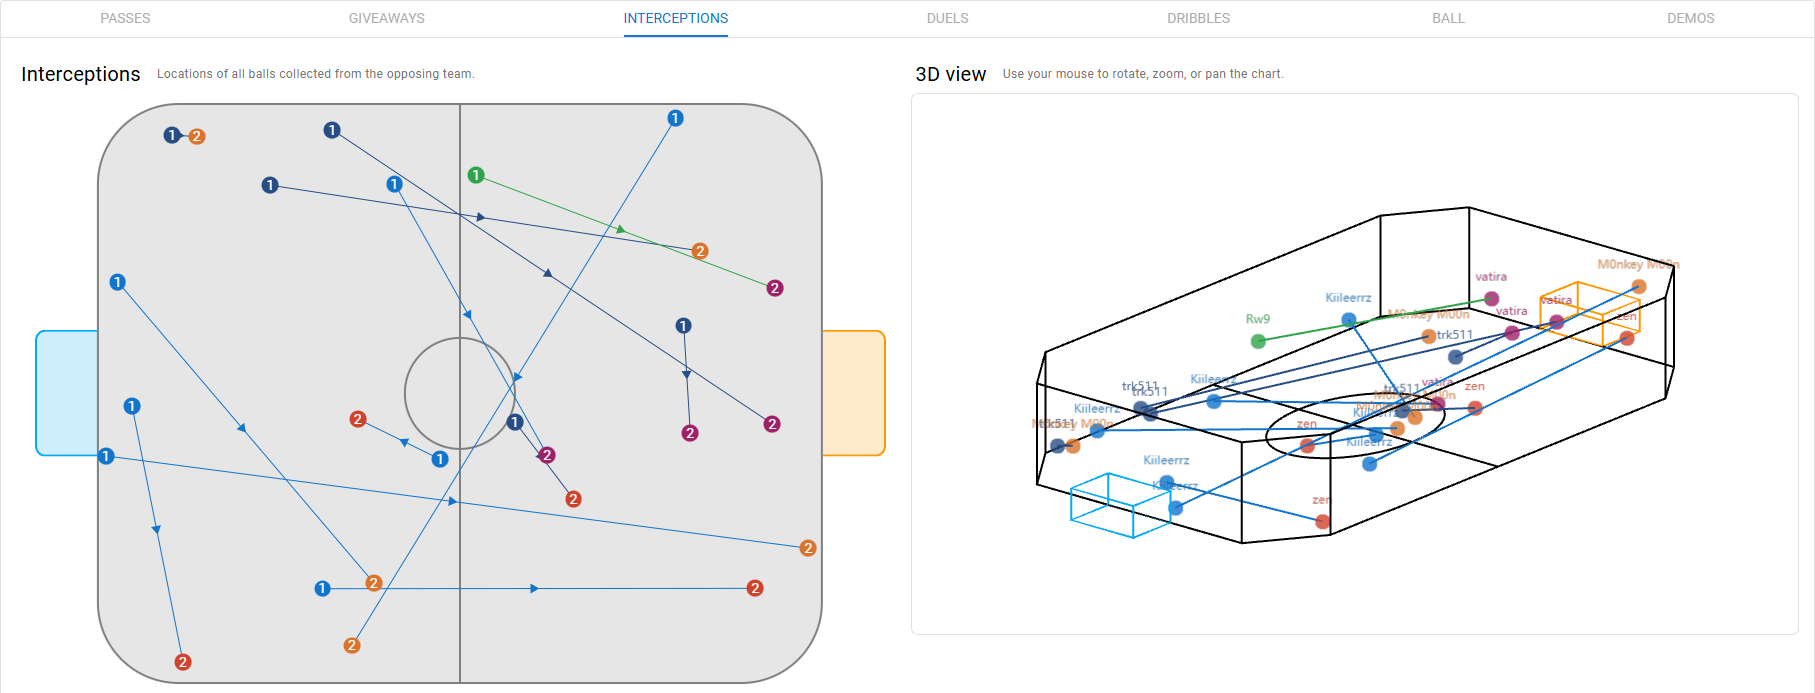
Interactions covers passes, giveaways, 50/50s, dribbles, and demos, filterable by player. If you keep losing the ball in the same situations, it shows up here. Boost maps where you pick up pads, shows team control across the field, and includes a Boost Pickup Routes overlay that connects pads grabbed in sequence. The more you repeat the same route, the thicker the line, making predictable habits easy to spot. Movement shows heatmaps and 3D path maps so you can see if you're overloading one side of the field, plus a Facing Ball stat tracking what percentage of the match each player was oriented toward the ball. Correlations lets you compare any two stats to find cause-and-effect patterns in your playstyle. You can export the full game as a CSV, JSON, or an LLM-ready Markdown file directly from the analysis view.
Analyze a Series of Games
Load multiple replays and CARL2 compiles everything into a single series view. Every map, chart, and stat table aggregates across all games, and per-player toggles let you isolate anyone in the lobby. This is where patterns become clear: tendencies that don't show up in one game become obvious across five or ten.
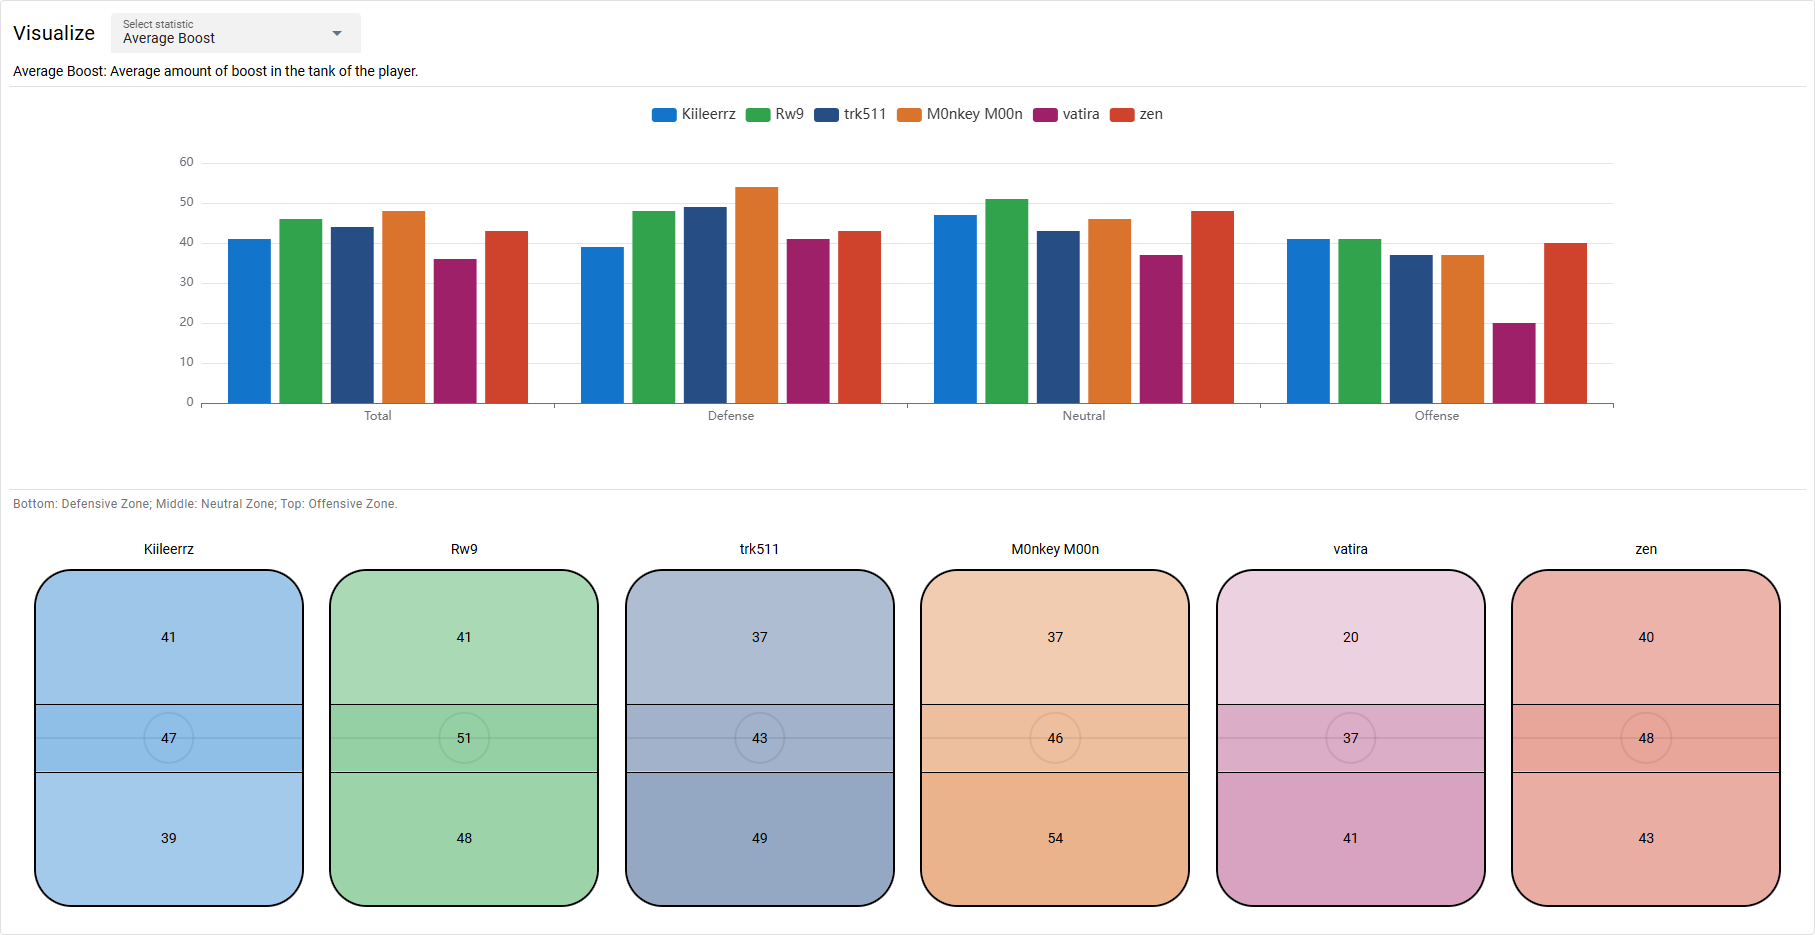
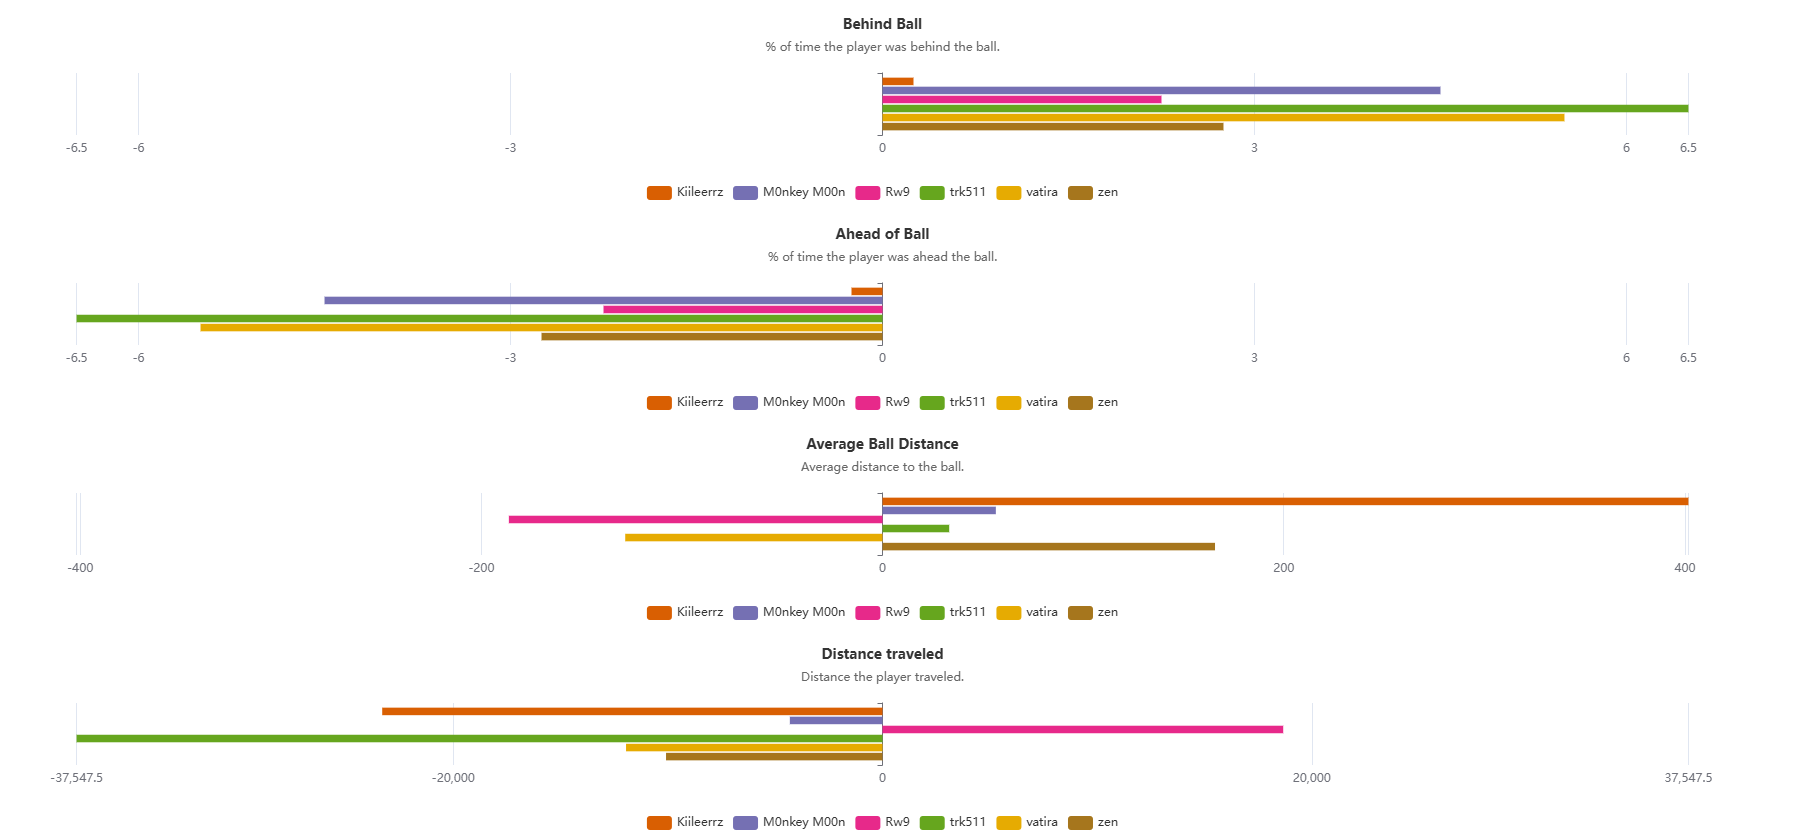
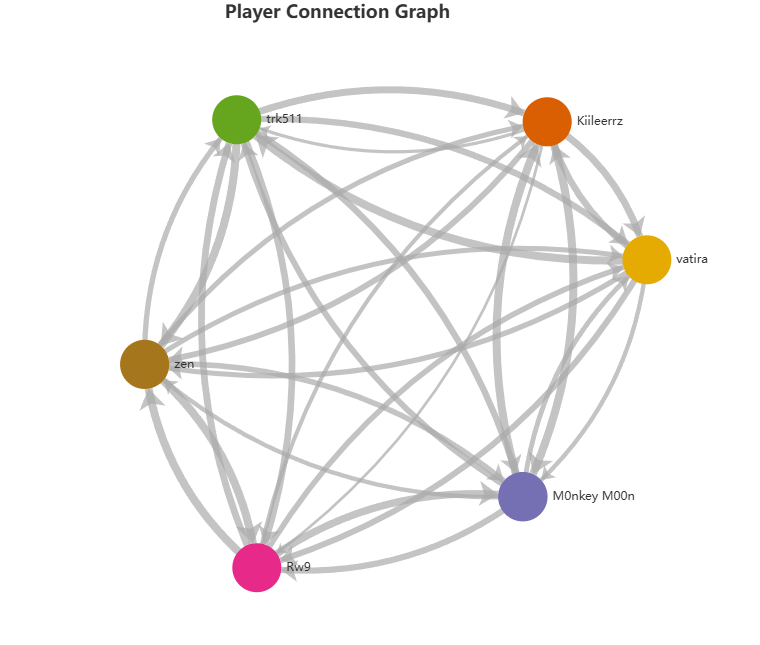
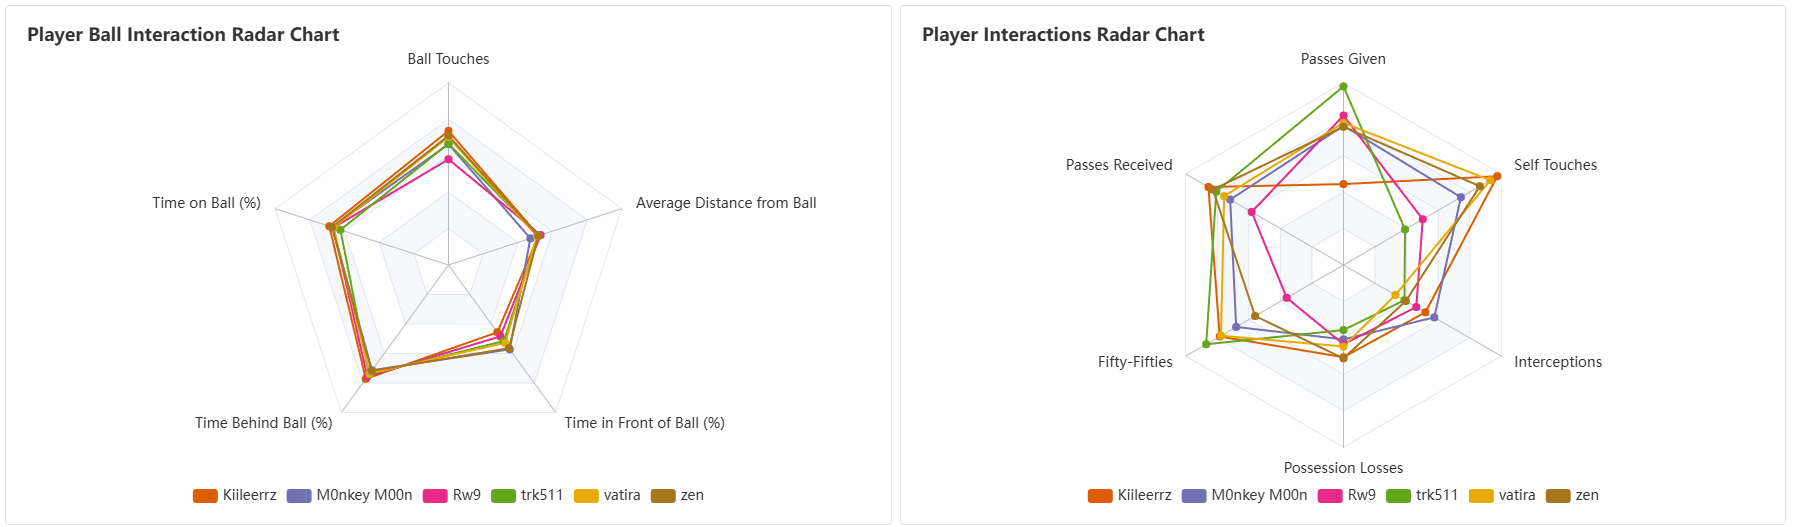
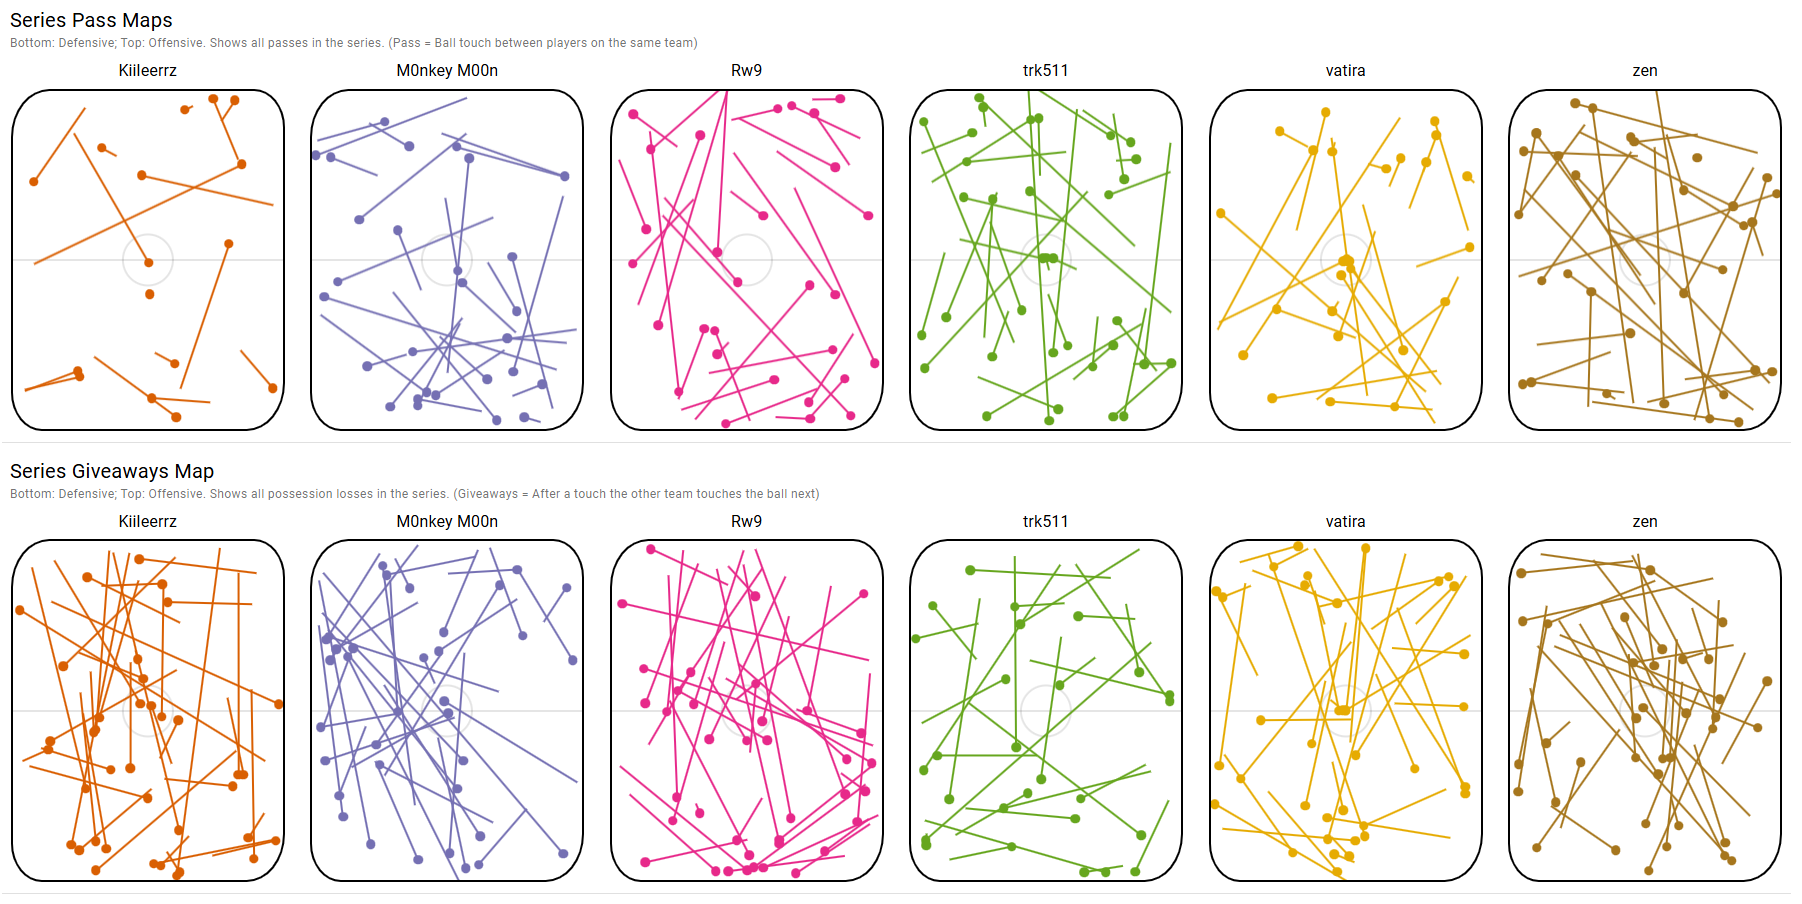
Series Overview shows pass maps, giveaway maps, duel maps, and goal maps, all available in 3D. Per-player Shot Maps cover the full series with the same xG model and filters as the single game view. Player Connections graphs which teammates and opponents the ball moved through most, so you can see who's feeding who and where miscommunications happen. Outlier Detection flags players with standout or inconsistent stats across the series. Series Averages gives per-player averages backed by radar charts, heatmaps, boost pickup maps, and zone-based breakdowns for every metric.
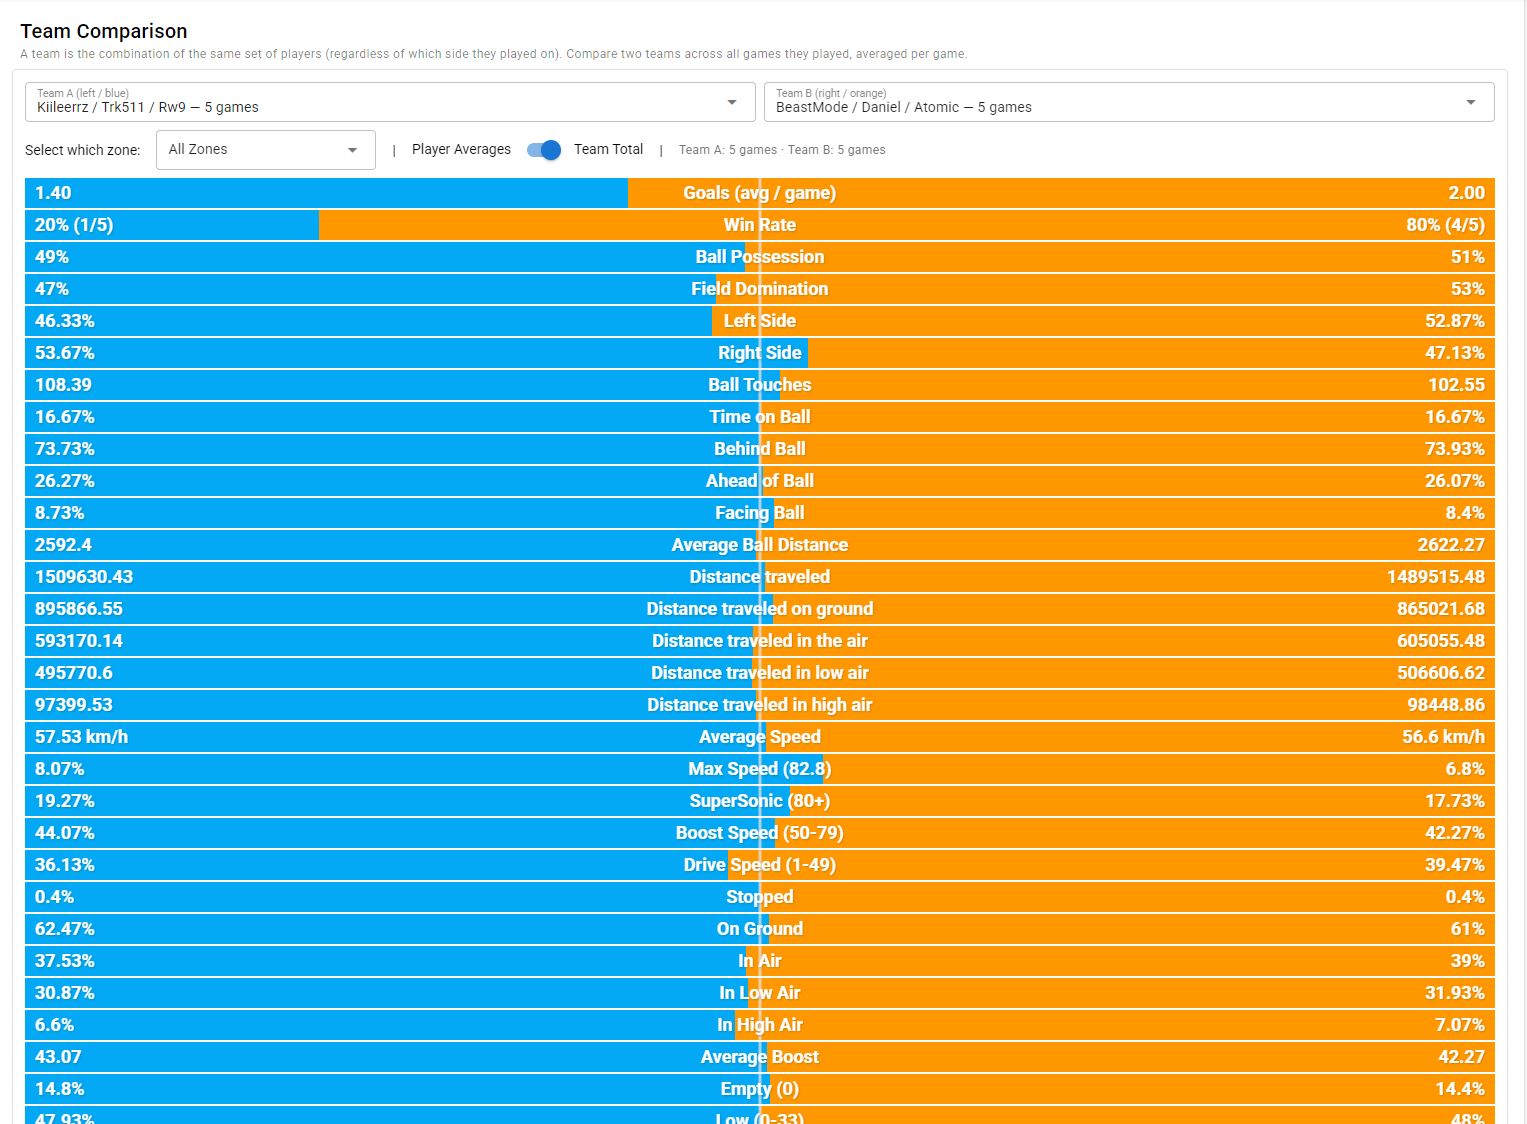
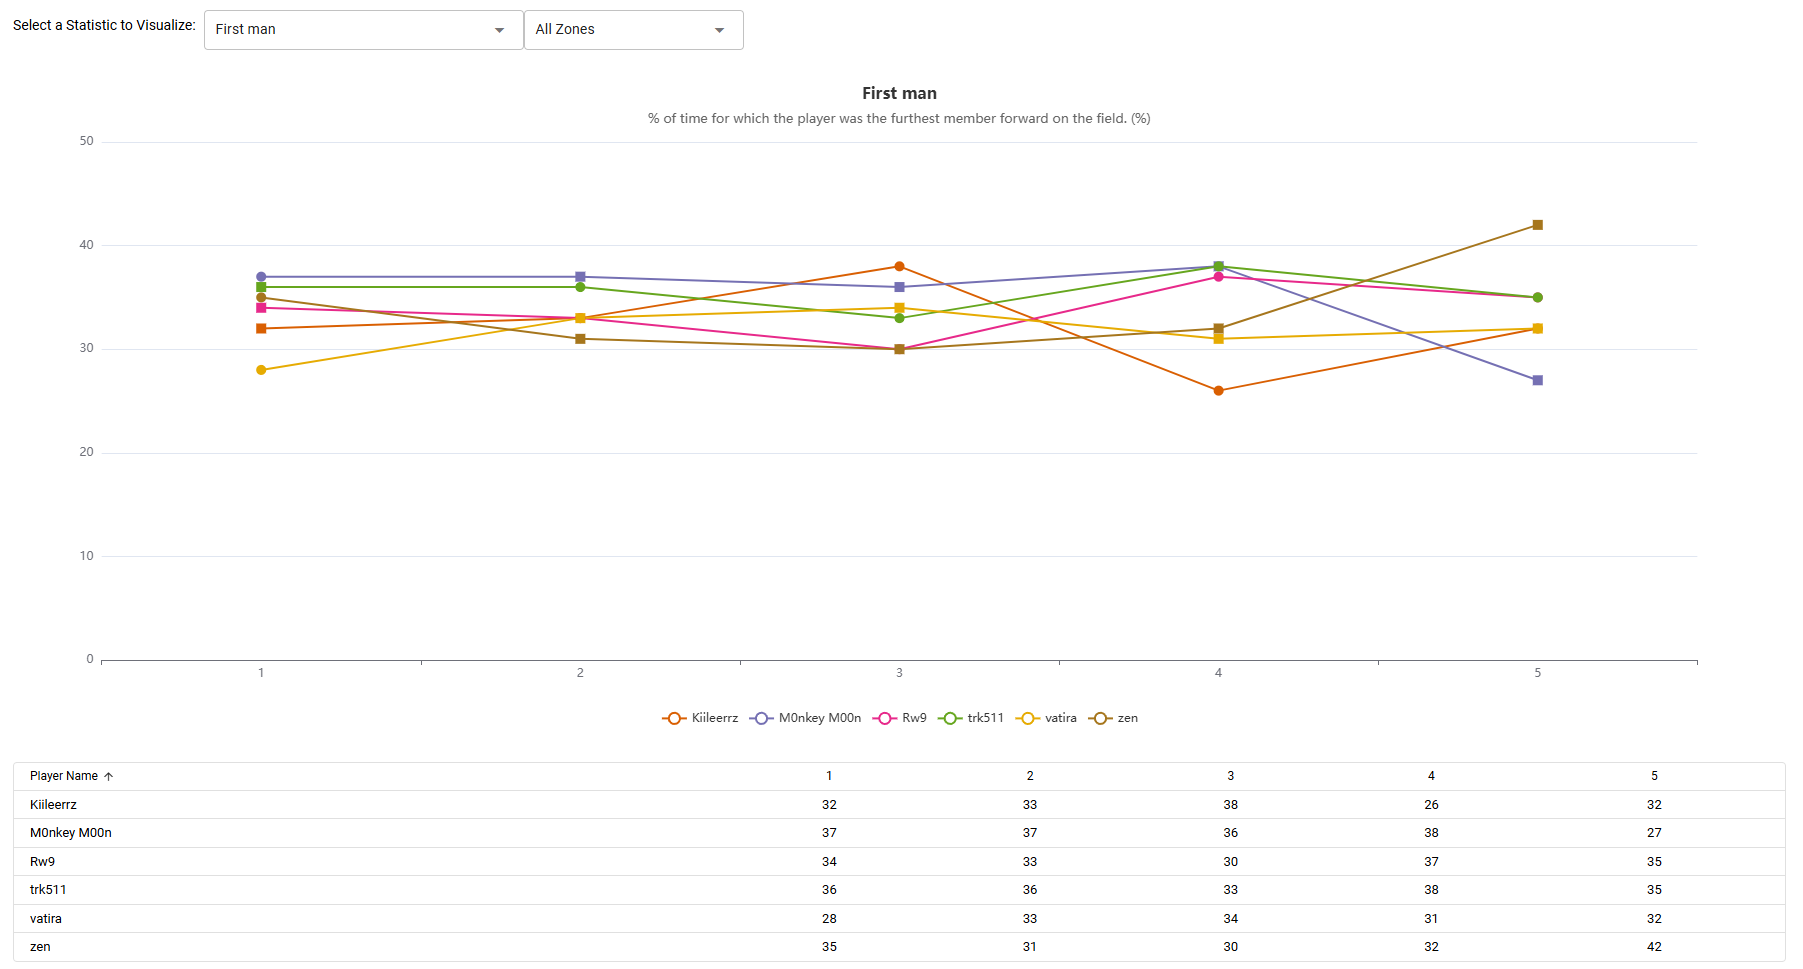
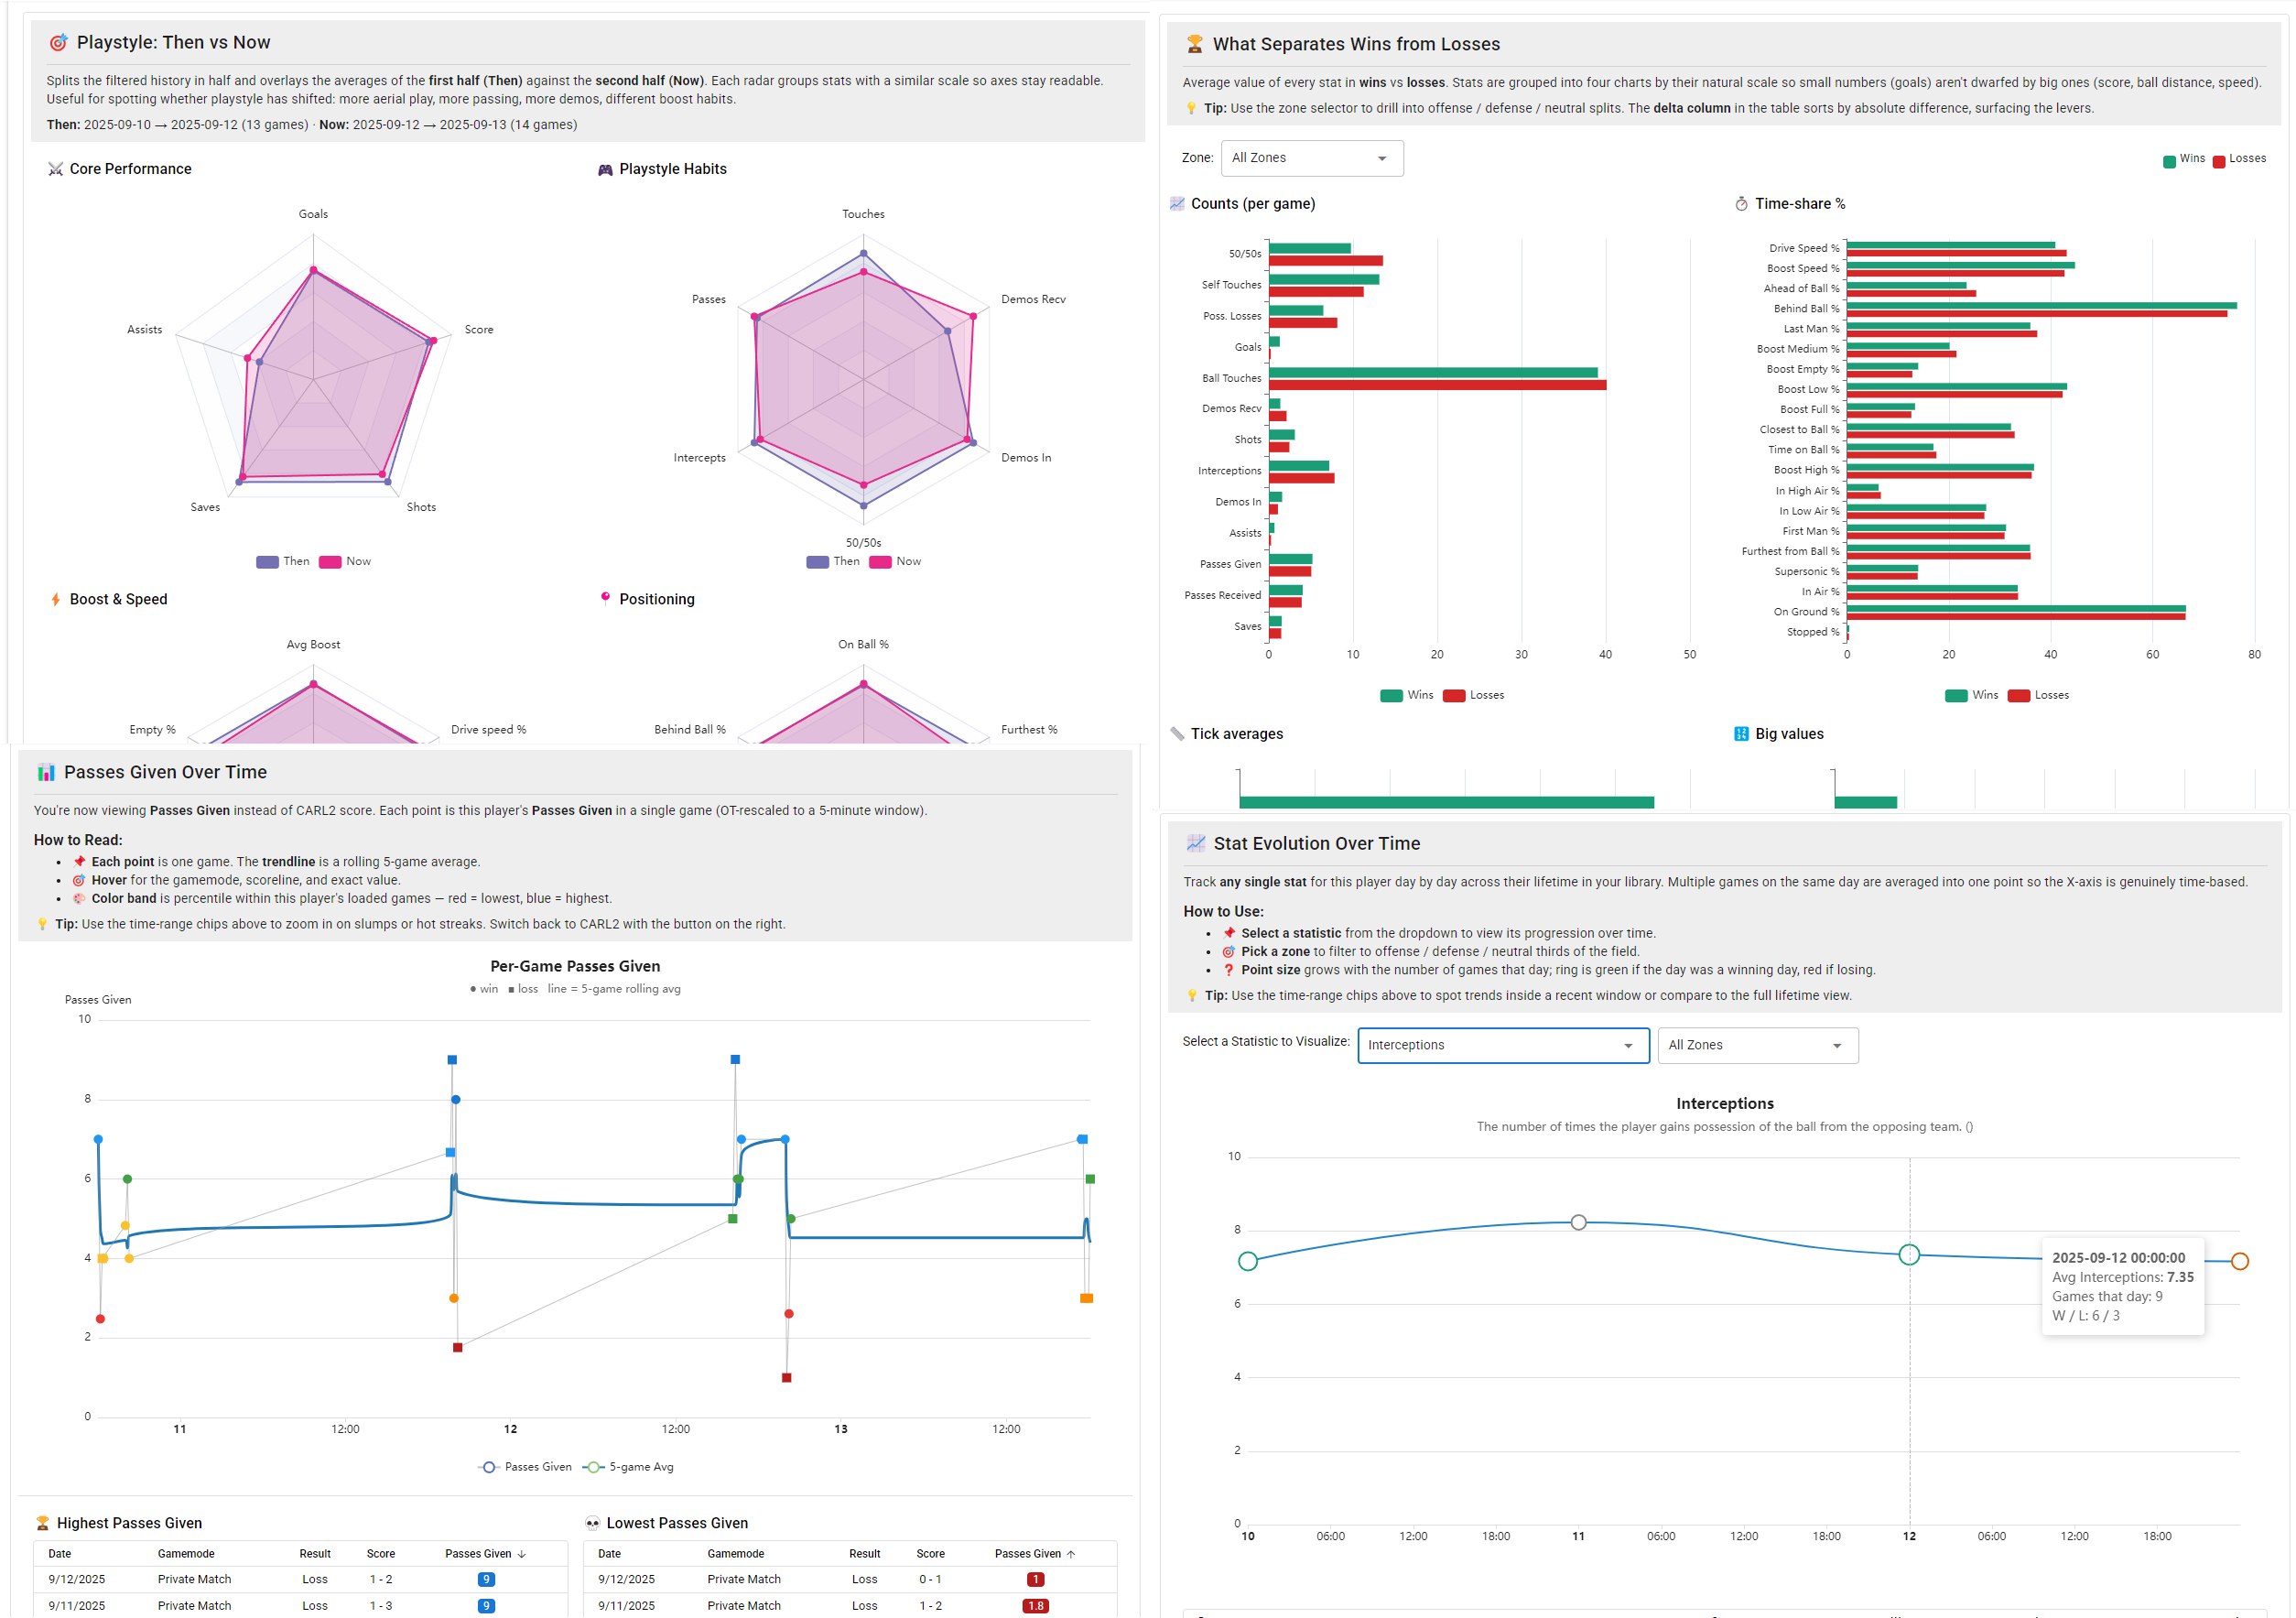
The Team Comparison tab puts both teams side by side across all games, with a toggle between per-player averages and team totals. Win vs. Loss Analysis shows how your stats change between wins and defeats. It often reveals habits you only fall into when you're losing. Evolution tracks each stat game by game, so you can see if your boost consistency is trending up or if positioning is slipping. Correlations lets you compare any two stats against each other, including goals, shots, assists, and saves. Stats from forfeited or short games are scaled to a standard 5-minute game so one early concede doesn't drag down your averages.
From the Export tab you can download full series data as CSV or JSON, with a configurable delimiter and a clear description for each file. A Download All as ZIP button bundles every export in one click. Each file includes a stable Match ID and Series ID so you can link the same game across different exports or external tools.
Player Lifetime Stats
Every replay and live game you've ever processed is indexed by player. Pick anyone you've played with or against and see their full history across all of your saved data, filtered to any time window you choose.
The player view has eight tabs. Overview shows key stats and recent form. CARL2 Score plots their performance rating over time so you can see if they're genuinely improving or just having a hot streak. Stats Evolution lets you pick any individual stat and track it game by game. Win vs. Loss breaks down how their numbers shift between wins and defeats. Then vs. Now puts two time windows on a radar chart side by side, making it easy to see what's actually changed. Gamemodes separates ranked, unranked, and custom games. Teammates and Opponents shows who they win and lose with most, which is useful for scouting or team building. Games lists every match in one place.
A time range filter at the top narrows all tabs at once to the last 1, 3, 6, or 12 months. Instead of digging through individual replays to track progress, you can see everything about a player across your entire library in one view.
Live Modes
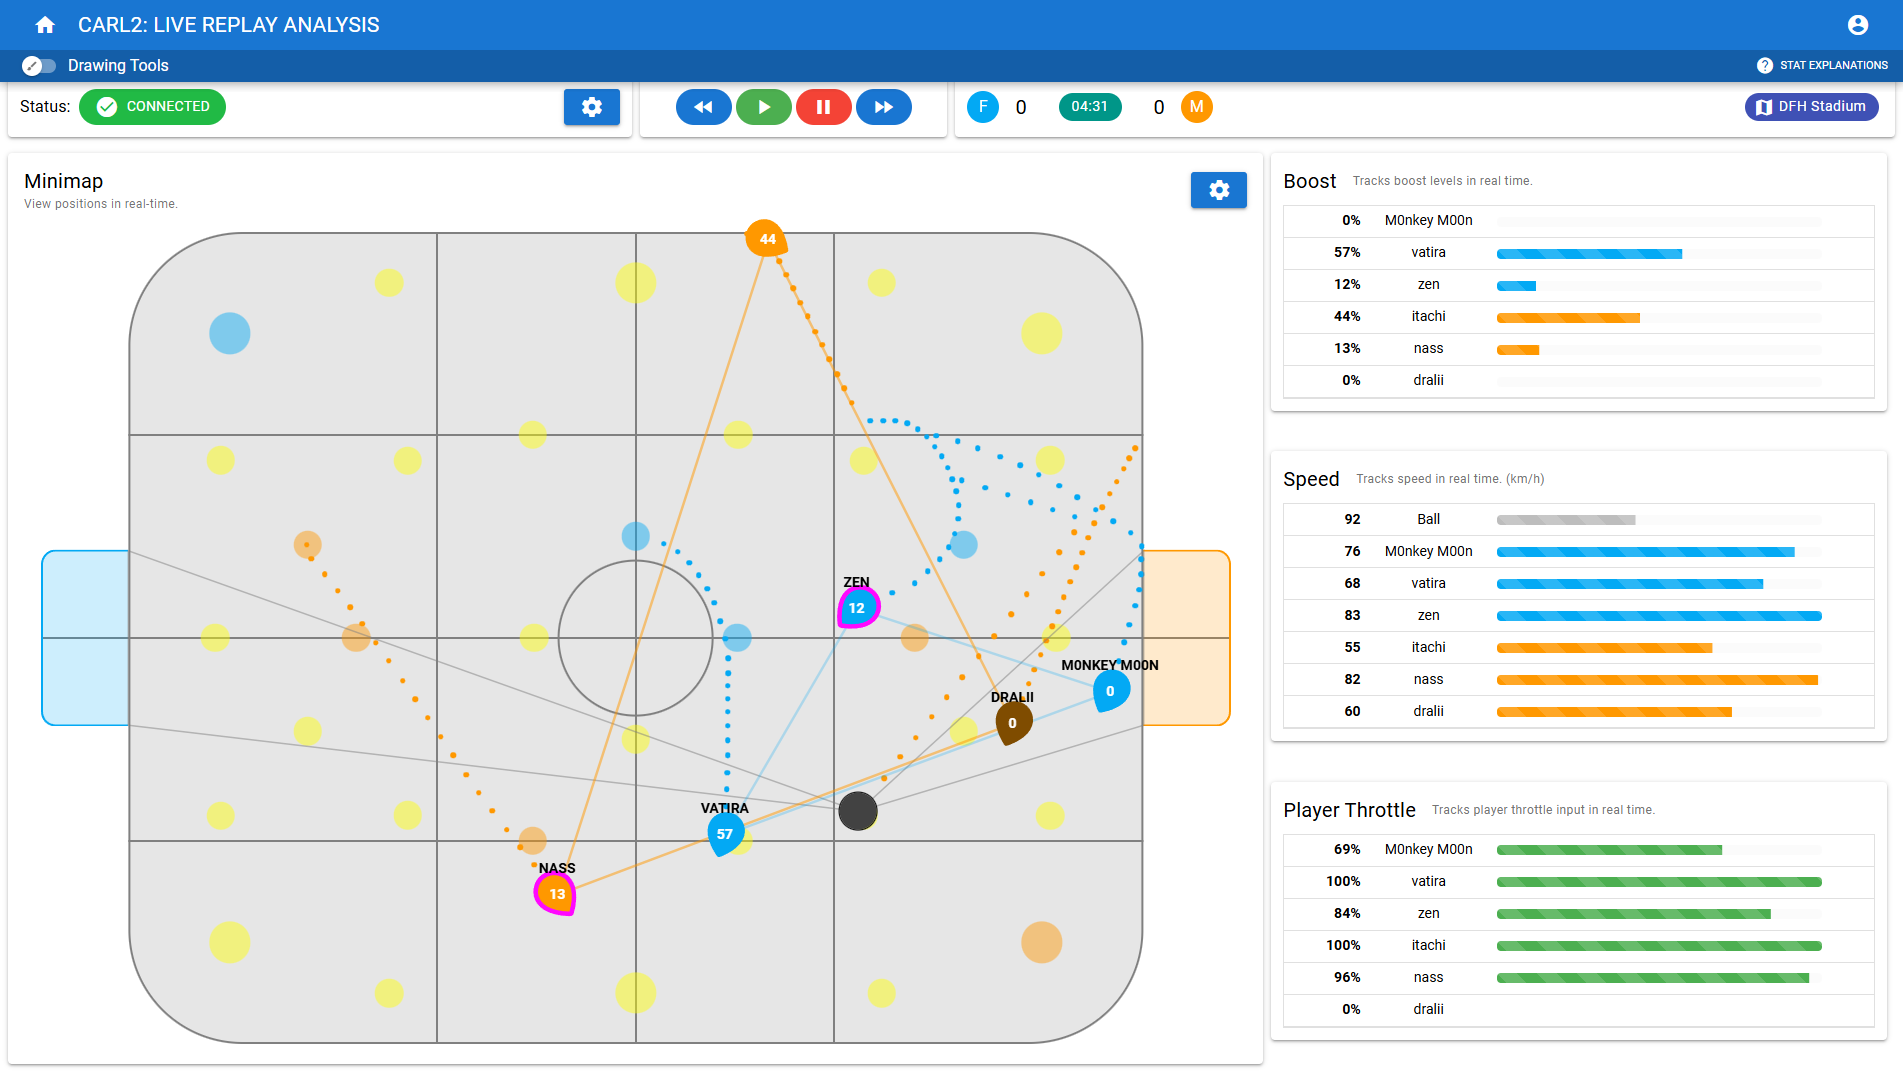
CARL2 connects to a live Rocket League session and shows a minimap, boost meters, speed, throttle data, and a stat feed that all update in real time. Four modes cover the main use cases.
Live Replay Analysis lets you control a replay playing in Rocket League from within CARL2, rewinding, pausing, or fast-forwarding while the minimap stays in sync. The layout is fully customizable: drag and resize every panel, save your arrangement, and reset it any time. It's ideal for going back to a specific moment right after a game ends.
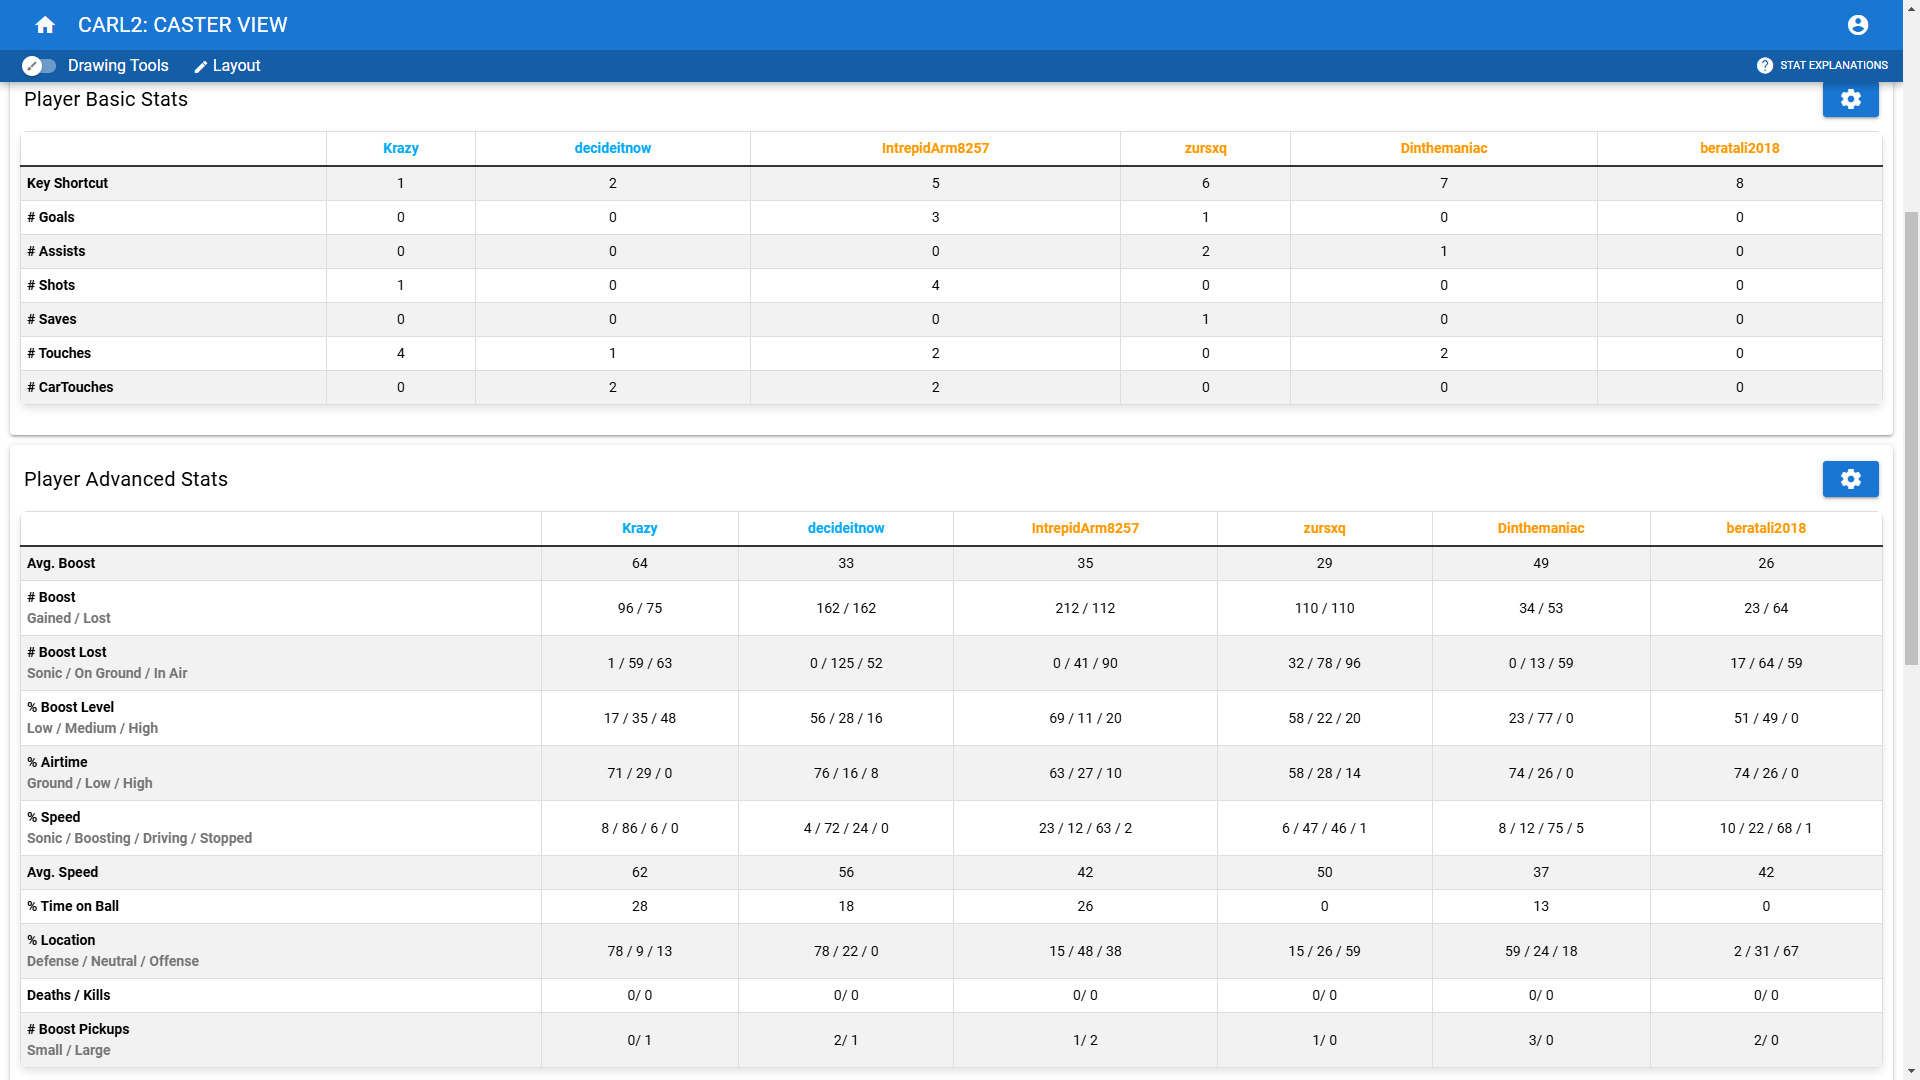
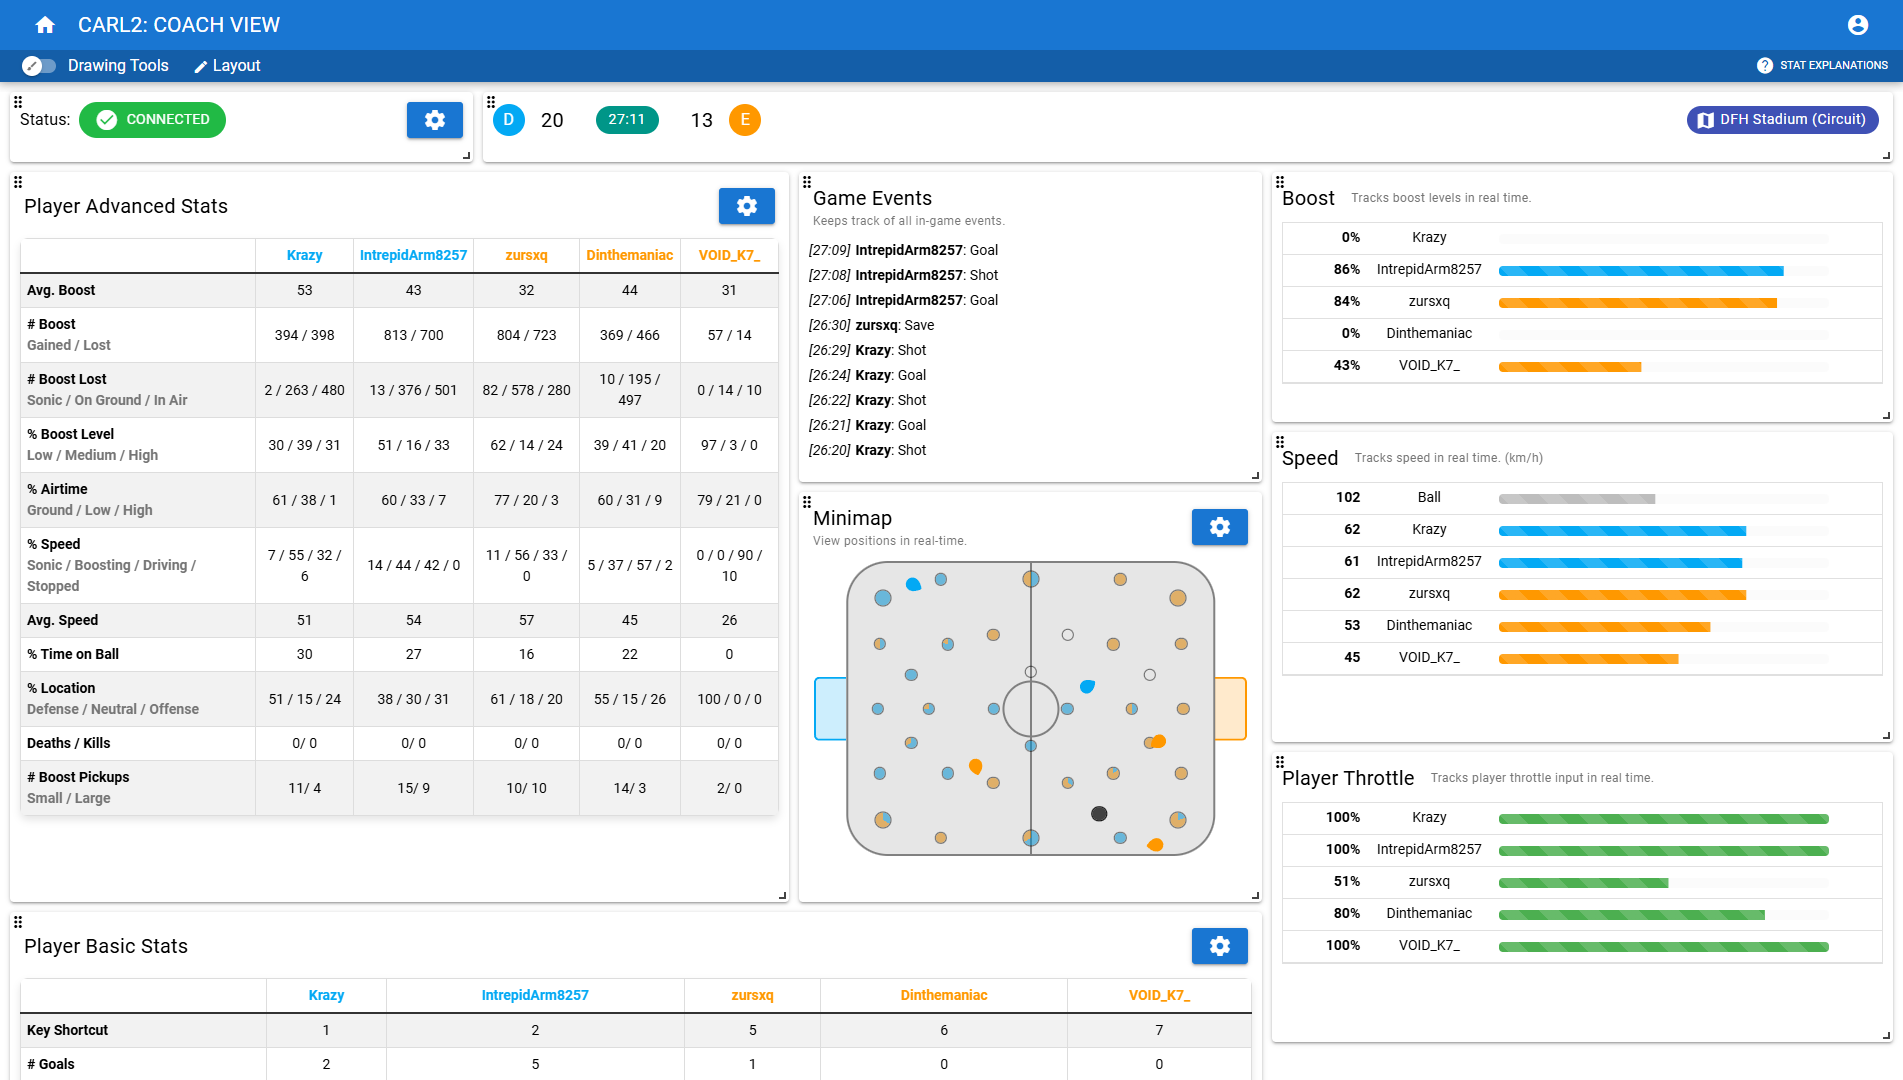
Observer / Admin Mode tracks live games with a player list showing pings and a live event feed. Tournament admins use it to keep an eye on connections and flag anything unusual mid-match. Coach Mode adds team stats, chat history, and toggleable stat panels you can reorder to put your priorities front and center. A toggle switches between individual player averages and team totals so you can switch context mid-game. If a player's boost is consistently low, you can pull it up and give feedback on the spot. Caster Mode trims the layout down to the stats most useful for commentary, highlighting things like boost control and supersonic time to give viewers more to follow.
Every spectated game saves automatically so you can load it for full replay analysis afterwards. CARL2 supports both BakkesMod and the Easy Anti-Cheat system in the current version of Rocket League.
Real-Time Stats Screen
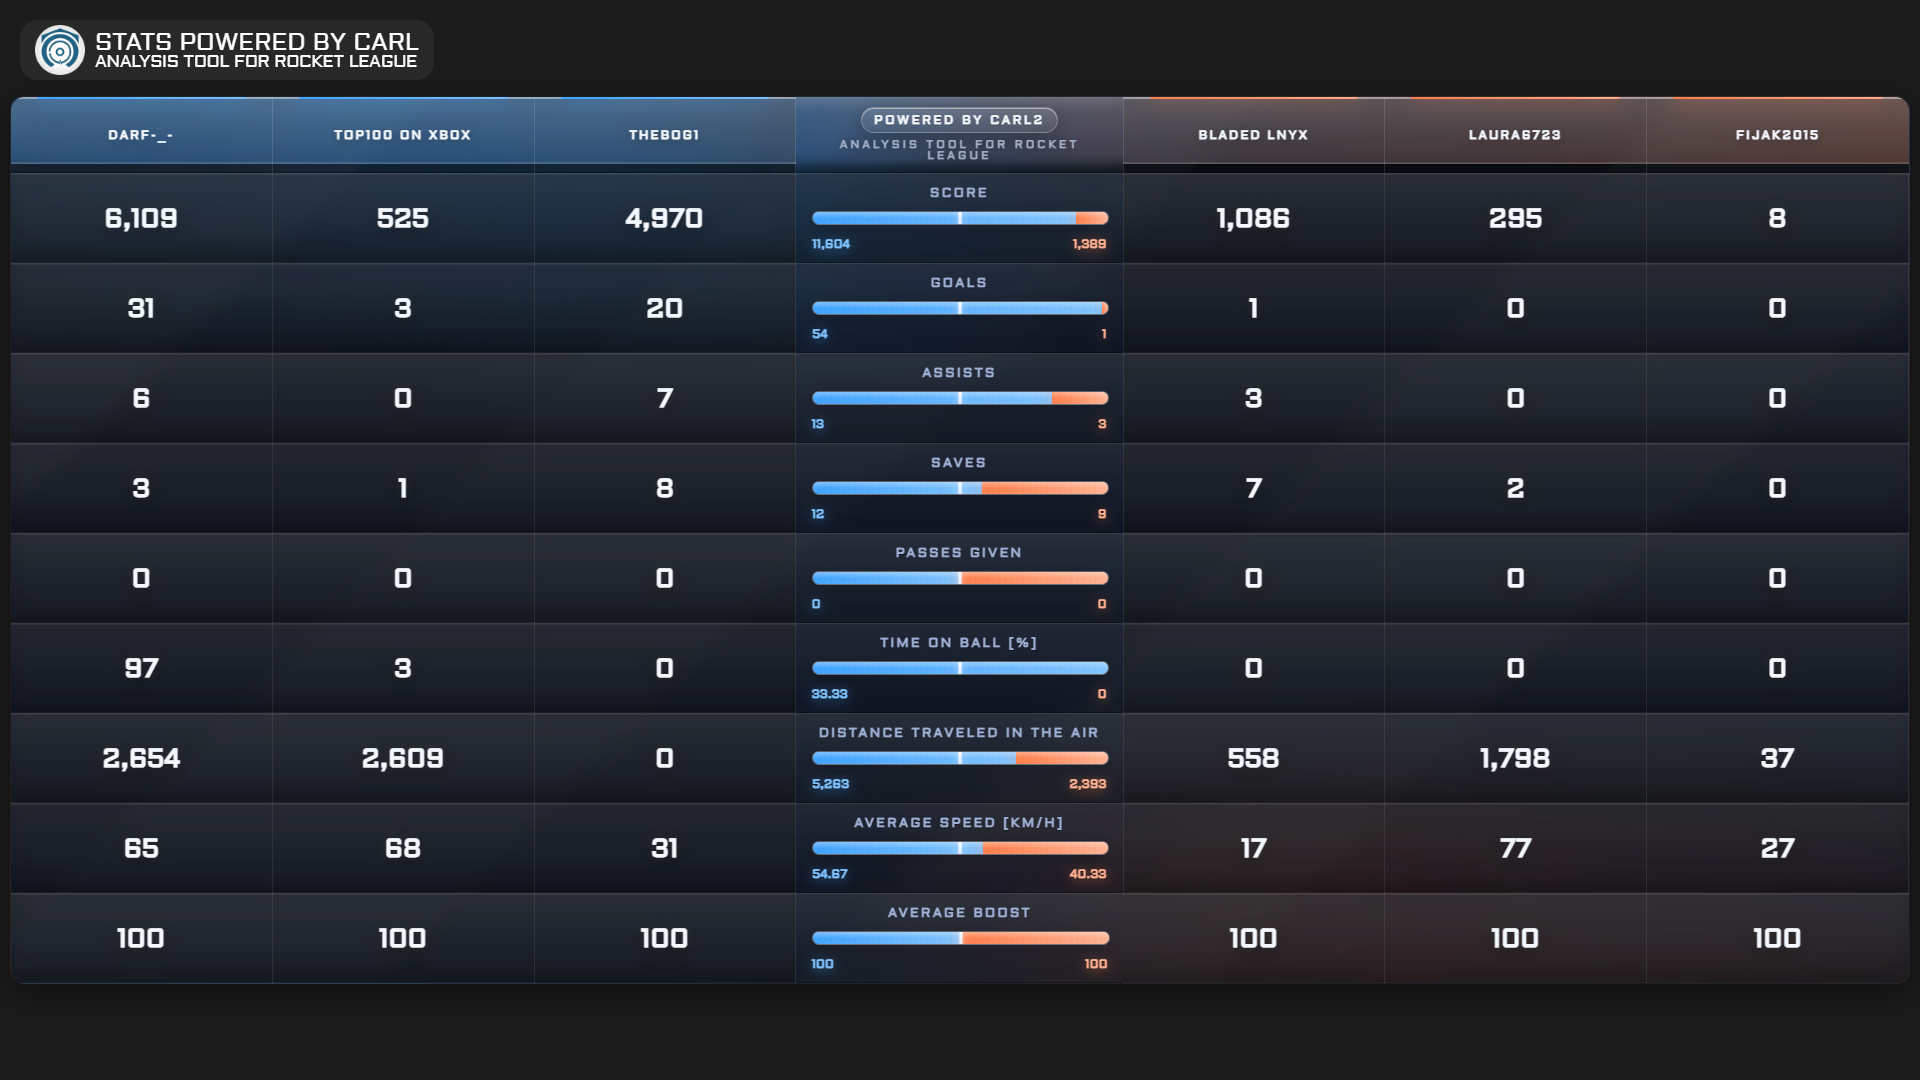
The Stats Screen shows live game stats as a browser source overlay that your viewers can see on stream. Add it to OBS or any capture tool and it updates in real time, showing boost levels, scores, and key stats without covering your game window.
Choose from over ten designs, each with a different layout and visual style. Toggle it on and off from within CARL2 without interrupting your session. It works during both spectated and active games, so whether you're casting or playing, your audience always has something to look at between plays.
Download CARL2
CARL2 is free. Install BakkesMod first, as it handles the connection between CARL2 and Rocket League. Then download CARL2 from the link below, create an account with your email address, confirm it, and you're ready to load your first replay.
The Discord is the best place for support, bug reports, and feature requests. Updates ship regularly and appear in the in-app changelog whenever something new is added.
Getting Started
The Quickstart Guide below walks through installing CARL2, processing your first replay, and navigating the interface. It covers both single game and series analysis, and shows how to get into the live modes.